

Does recombination shape the distribution and evolution of tandemly arrayed genes (TAGs) in the Arabidopsis thaliana genome?
- PMID: 14656961
- PMCID: PMC403795
- DOI: 10.1101/gr.1318503
Does recombination shape the distribution and evolution of tandemly arrayed genes (TAGs) in the Arabidopsis thaliana genome?
Abstract
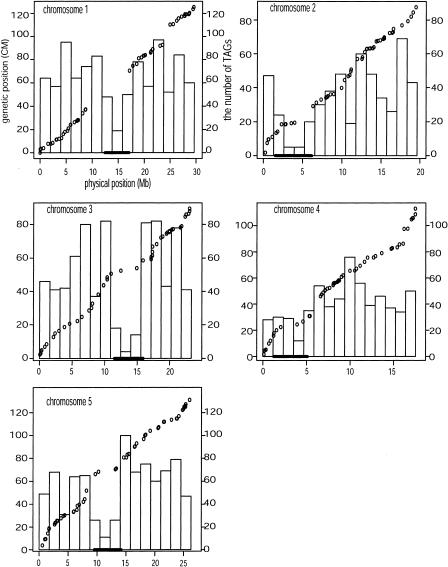
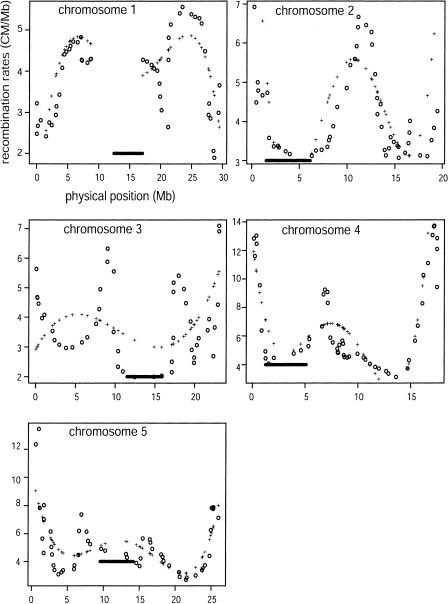
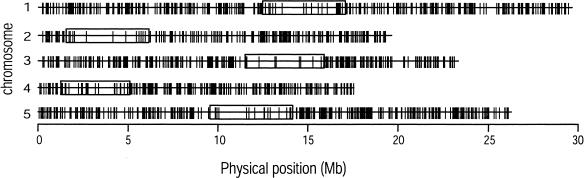
Tandemly arrayed genes (TAGs) are an important genomic component. However, most previous studies have focused on individual TAG families, and a broader characterization of their genomic distribution is not yet available. In this study, we examined the distribution of TAGs in the Arabidopsis thaliana genome and examined TAG density with relation to recombination rates. Recombination rates along A. thaliana chromosomes were estimated by comparing a genetic map with the genome sequence. Average recombination rates in A. thaliana are high, and rates vary more than threefold among chromosomal regions. Comparisons between TAG density and recombination indicate a positive correlation on chromosomes 1, 2, and 3. Moreover, there is a consistent centromeric effect. Relative to single-copy genes, TAGs are proportionally less frequent in centromeres than on chromosomal arms. We also examined several factors that have been proposed to affect the sequence evolution of TAG members. Sequence divergence is related to the number of members in the TAG, but genomic location has no obvious effect on TAG sequence divergence, nor does the presence of unrelated genes within a TAG. Overall, the distribution of TAGs in the genome is not consistent with theoretical models predicting the accumulation of repeats in regions of low recombination but may be consistent with stabilizing selection models of TAG evolution.
Figures
Similar articles
-
Striking similarities in the genomic distribution of tandemly arrayed genes in Arabidopsis and rice.PLoS Comput Biol. 2006 Sep 1;2(9):e115. doi: 10.1371/journal.pcbi.0020115. Epub 2006 Jul 20. PLoS Comput Biol. 2006. PMID: 16948529 Free PMC article.
-
A roadmap of tandemly arrayed genes in the genomes of human, mouse, and rat.Mol Biol Evol. 2006 Nov;23(11):2134-41. doi: 10.1093/molbev/msl085. Epub 2006 Aug 10. Mol Biol Evol. 2006. PMID: 16901985
-
Interactions among genomic structure, function, and evolution revealed by comprehensive analysis of the Arabidopsis thaliana genome.Genomics. 2006 Oct;88(4):394-406. doi: 10.1016/j.ygeno.2006.05.003. Epub 2006 Jun 27. Genomics. 2006. PMID: 16806804
-
Meiotic recombination hotspots in plants.Biochem Soc Trans. 2006 Aug;34(Pt 4):531-4. doi: 10.1042/BST0340531. Biochem Soc Trans. 2006. PMID: 16856852 Review.
-
Plant centromere organization: a dynamic structure with conserved functions.Trends Genet. 2007 Mar;23(3):134-9. doi: 10.1016/j.tig.2007.01.004. Epub 2007 Feb 1. Trends Genet. 2007. PMID: 17275131 Review.
Cited by
-
An integrated cytogenetic and physical map reveals unevenly distributed recombination spots along the papaya sex chromosomes.Chromosome Res. 2012 Aug;20(6):753-67. doi: 10.1007/s10577-012-9312-1. Epub 2012 Sep 25. Chromosome Res. 2012. PMID: 23007683
-
Conservation and divergence of light-regulated genome expression patterns during seedling development in rice and Arabidopsis.Plant Cell. 2005 Dec;17(12):3239-56. doi: 10.1105/tpc.105.035840. Epub 2005 Nov 11. Plant Cell. 2005. PMID: 16284311 Free PMC article.
-
Striking similarities in the genomic distribution of tandemly arrayed genes in Arabidopsis and rice.PLoS Comput Biol. 2006 Sep 1;2(9):e115. doi: 10.1371/journal.pcbi.0020115. Epub 2006 Jul 20. PLoS Comput Biol. 2006. PMID: 16948529 Free PMC article.
-
Fine-scale population recombination rates, hotspots, and correlates of recombination in the Medicago truncatula genome.Genome Biol Evol. 2012;4(5):726-37. doi: 10.1093/gbe/evs046. Epub 2012 May 3. Genome Biol Evol. 2012. PMID: 22554552 Free PMC article.
-
A high-resolution map of Arabidopsis recombinant inbred lines by whole-genome exon array hybridization.PLoS Genet. 2006 Sep 15;2(9):e144. doi: 10.1371/journal.pgen.0020144. Epub 2006 Jul 27. PLoS Genet. 2006. PMID: 17044735 Free PMC article.
References
-
- Arabidopsis Genome Initiative. 2000. Analysis of the genome sequence of the flowering plant Arabidopsis thaliana. Nature 408: 796-815. - PubMed
-
- Bartolomé, C., Maside, X., and Charlesworth, B. 2002. On the abundance and distribution of transposable elements in the genome of Drosophila melanogaster. Mol. Biol. Evol. 19: 926-937. - PubMed
-
- Charlesworth, B. and Charlesworth, D. 1979. The evolutionary genetics of sexual systems in flowering plants. Proc. R. Soc. Lond. B 205: 513-530. - PubMed
WEB SITE REFERENCES
-
- ftp://tairpub:tairpub@ftp.arabidopsis.org/home/tair/Maps/mapviewer_data; marker information from the Lister and Dean 1993 RI map and genetic map positions.
-
- http://www.arabidopsis.org/servlets/Search?action=new_search&type=marker; information about the physical locations of genetic markers in the genome sequence.
Publication types
MeSH terms
LinkOut - more resources
Full Text Sources