

Sequence information for the splicing of human pre-mRNA identified by support vector machine classification
- PMID: 14656968
- PMCID: PMC403805
- DOI: 10.1101/gr.1679003
Sequence information for the splicing of human pre-mRNA identified by support vector machine classification
Abstract
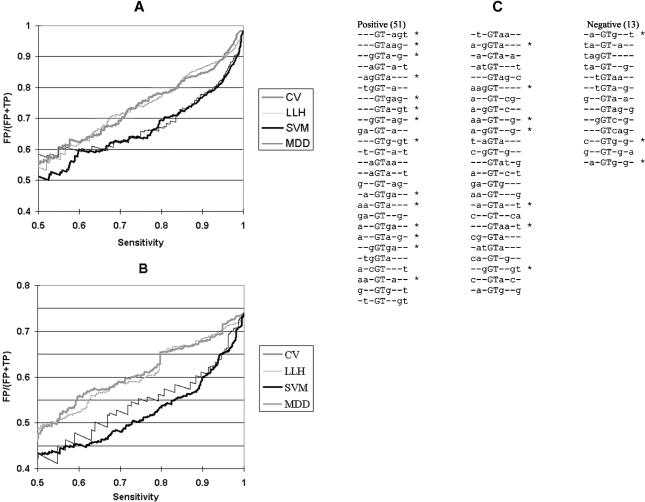
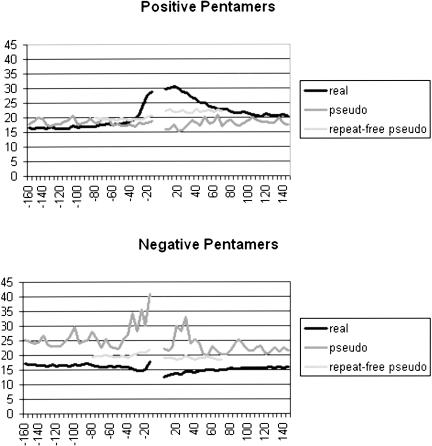
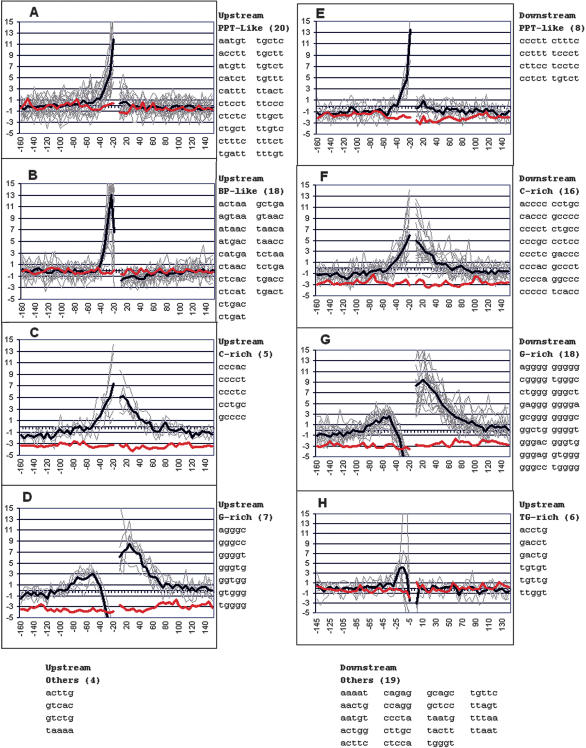
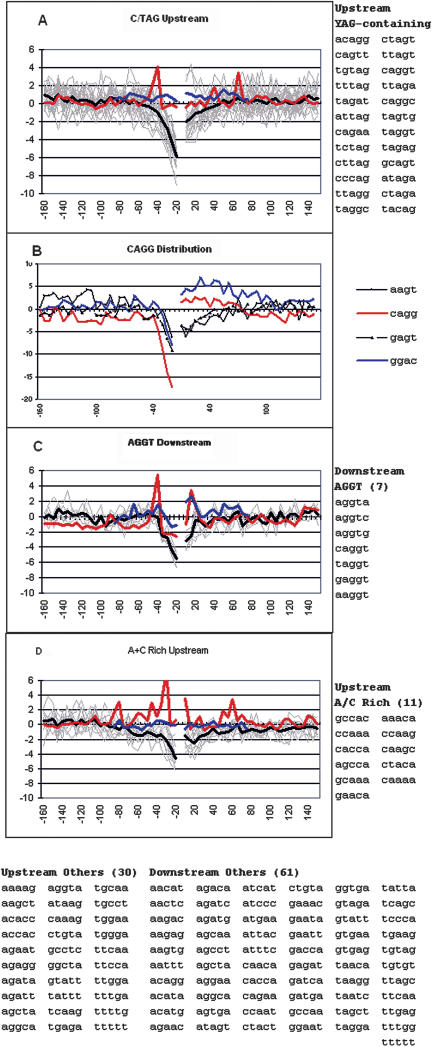
Vertebrate pre-mRNA transcripts contain many sequences that resemble splice sites on the basis of agreement to the consensus,yet these more numerous false splice sites are usually completely ignored by the cellular splicing machinery. Even at the level of exon definition,pseudo exons defined by such false splices sites outnumber real exons by an order of magnitude. We used a support vector machine to discover sequence information that could be used to distinguish real exons from pseudo exons. This machine learning tool led to the definition of potential branch points,an extended polypyrimidine tract,and C-rich and TG-rich motifs in a region limited to 50 nt upstream of constitutively spliced exons. C-rich sequences were also found in a region extending to 80 nt downstream of exons,along with G-triplet motifs. In addition,it was shown that combinations of three bases within the splice donor consensus sequence were more effective than consensus values in distinguishing real from pseudo splice sites; two-way base combinations were optimal for distinguishing 3' splice sites. These data also suggest that interactions between two or more of these elements may contribute to exon recognition,and provide candidate sequences for assessment as intronic splicing enhancers.
Figures
Similar articles
-
Exonic splicing enhancers contribute to the use of both 3' and 5' splice site usage of rat beta-tropomyosin pre-mRNA.RNA. 1999 Mar;5(3):378-94. doi: 10.1017/s1355838299981050. RNA. 1999. PMID: 10094307 Free PMC article.
-
Dichotomous splicing signals in exon flanks.Genome Res. 2005 Jun;15(6):768-79. doi: 10.1101/gr.3217705. Genome Res. 2005. PMID: 15930489 Free PMC article.
-
Can a 'patch' in a skipped exon make the pre-mRNA splicing machine run better?Trends Mol Med. 2003 Jun;9(6):229-32; discussion 233-4. doi: 10.1016/s1471-4914(03)00072-8. Trends Mol Med. 2003. PMID: 12829008
-
Searching for splicing motifs.Adv Exp Med Biol. 2007;623:85-106. doi: 10.1007/978-0-387-77374-2_6. Adv Exp Med Biol. 2007. PMID: 18380342 Review.
-
Exonization of transposed elements: A challenge and opportunity for evolution.Biochimie. 2011 Nov;93(11):1928-34. doi: 10.1016/j.biochi.2011.07.014. Epub 2011 Jul 26. Biochimie. 2011. PMID: 21787833 Review.
Cited by
-
Discovering weighted patterns in intron sequences using self-adaptive harmony search and back-propagation algorithms.ScientificWorldJournal. 2013 May 8;2013:249034. doi: 10.1155/2013/249034. Print 2013. ScientificWorldJournal. 2013. PMID: 23737711 Free PMC article.
-
Improving the Caenorhabditis elegans genome annotation using machine learning.PLoS Comput Biol. 2007 Feb 23;3(2):e20. doi: 10.1371/journal.pcbi.0030020. Epub 2006 Dec 21. PLoS Comput Biol. 2007. PMID: 17319737 Free PMC article.
-
The splicing regulatory element, UGCAUG, is phylogenetically and spatially conserved in introns that flank tissue-specific alternative exons.Nucleic Acids Res. 2005 Feb 3;33(2):714-24. doi: 10.1093/nar/gki210. Print 2005. Nucleic Acids Res. 2005. PMID: 15691898 Free PMC article.
-
Prediction of alternatively skipped exons and splicing enhancers from exon junction arrays.BMC Genomics. 2008 Nov 20;9:551. doi: 10.1186/1471-2164-9-551. BMC Genomics. 2008. PMID: 19021909 Free PMC article.
-
Discovery and analysis of evolutionarily conserved intronic splicing regulatory elements.PLoS Genet. 2007 May 25;3(5):e85. doi: 10.1371/journal.pgen.0030085. Epub 2007 Apr 13. PLoS Genet. 2007. PMID: 17530930 Free PMC article.
References
-
- Bauren, G. and Wieslander, L. 1994. Splicing of Balbiani ring 1 gene pre-mRNA occurs simultaneously with transcription. Cell 76: 183-192. - PubMed
-
- Berget, S.M. 1995. Exon recognition in vertebrate splicing. J. Biol. Chem. 270: 2411-2414. - PubMed
-
- Burge, C. and Karlin, S. 1997. Prediction of complete gene structures in human genomic DNA. J. Mol. Biol. 268: 78-94. - PubMed
WEB SITE REFERENCES
-
- http://genes.mit.edu/burgelab/maxent/Xmaxentscan_scoreseq.html; maximum entrophy modeling of short sequence motifs by G. Yeo and C.B. Burge. - PubMed
-
- http://gepas.bioinfo.cnio.es/cgi-bin/somtree; combining hierarchical clustering and self-organizing maps by J. Herrero and J. Dopazo. - PubMed
-
- www.cs.columbia.edu/compbio; Computational Biology Group at Columbia.
Publication types
MeSH terms
Substances
Grants and funding
LinkOut - more resources
Full Text Sources
Other Literature Sources
Research Materials
Miscellaneous