. 2003 Dec 15;22(24):6471-82.
doi: 10.1093/emboj/cdg637.

A novel angiotensin II type 2 receptor signaling pathway: possible role in cardiac hypertrophy

Affiliations

A novel angiotensin II type 2 receptor signaling pathway: possible role in cardiac hypertrophy

Takaaki Senbonmatsu et al. EMBO J. .

Abstract

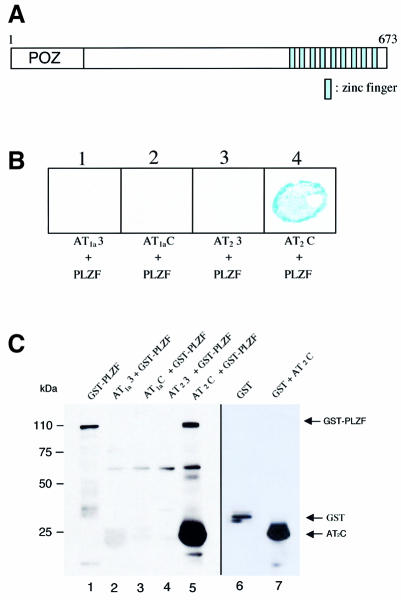
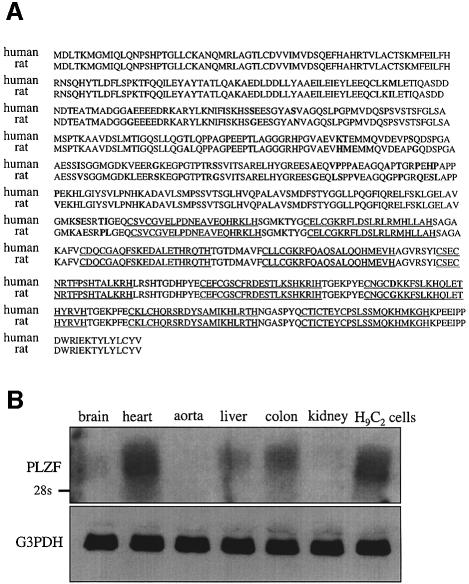
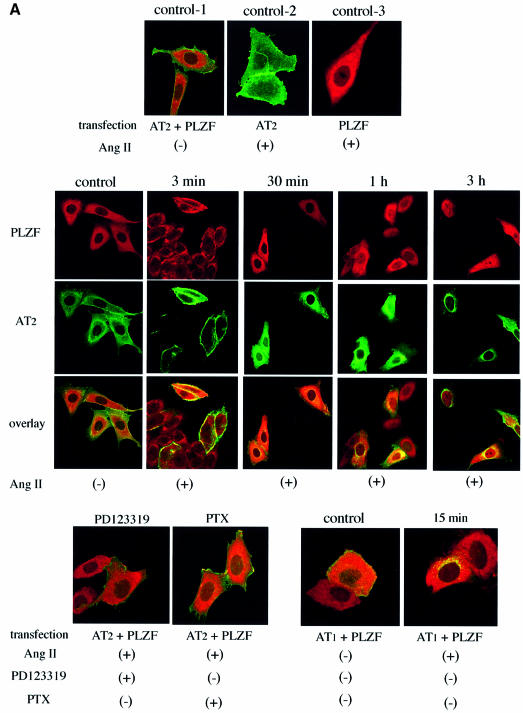
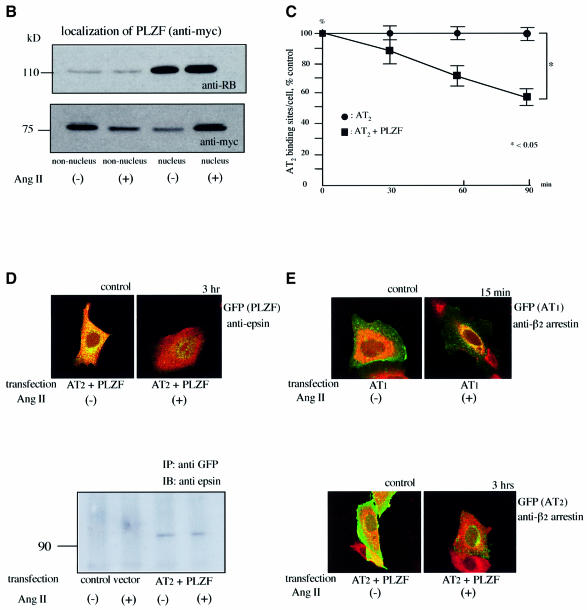
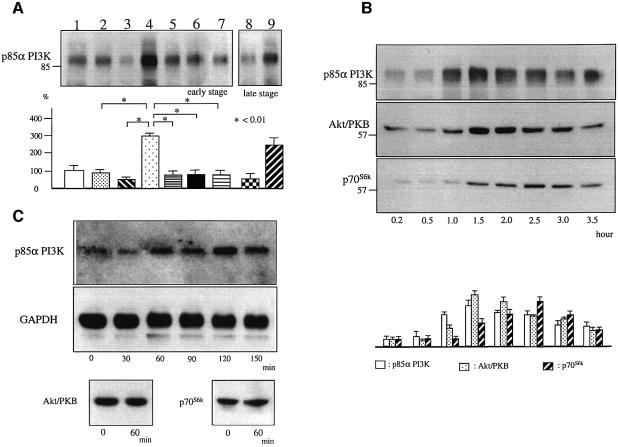
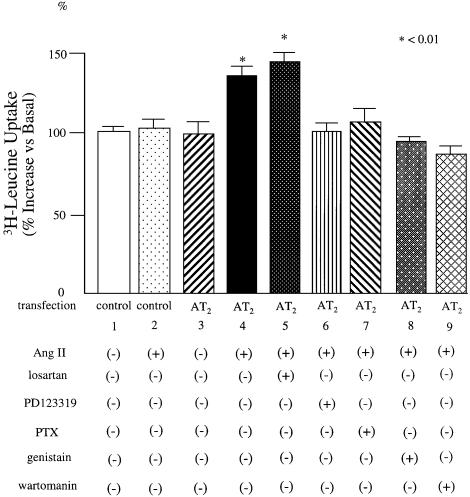
We describe a novel signaling mechanism mediated by the G-protein-coupled receptor (GPCR) angiotensin II (Ang II) type 2 receptor (AT(2)). Yeast two-hybrid studies and affinity column binding assay show that the isolated AT(2) C-terminus binds to the transcription factor promyelocytic zinc finger protein (PLZF). Cellular studies employing confocal microscopy show that Ang II stimulation induces cytosolic PLZF to co-localize with AT(2) at the plasma membrane, then drives AT(2) and PLZF to internalize. PLZF slowly emerges in the nucleus whereas AT(2) accumulates in the perinuclear region. Nuclear PLZF binds to a consensus sequence of the phosphatidylinositol-3 kinase p85 alpha subunit (p85 alpha PI3K) gene. AT(2) enhances expression of p85 alpha PI3K followed by enhanced p70(S6) kinase, essential to protein synthesis. An inactive mutant of PLZF abolishes this effect. PLZF is expressed robustly in the heart in contrast to many other tissues. This cardiac selective pathway involving AT(2), PLZF and p85 alpha PI3K may explain the absence of a cardiac hypertrophic response in AT(2) gene-deleted mice.


Figures

None
Fig. 1. The association of the C-terminal intracellular domain of the AT2 receptor with PLZF. (A) Schematic representation of the PLZF domain structure. (B) Testing the interaction of PLZF and Ang II receptor peptides in the yeast two-hybrid system. Lane 1, AT1a third intracellular loop + PLZF; lane 2, AT1a C-terminus + PLZF; lane 3, AT2 third intracellular loop + PLZF; lane 4, AT2 C-terminus + PLZF. Binding was visualized by the β-galactosidase assay. (C) Interaction of the GST–PLZF and Ang II receptor peptides tested by affinity columns. Lane 1, recombinant GST–PLZF; lane 2, GST–PLZF + His6-tagged AT1a third intracellular loop; lane 3, GST–PLZF + His6-tagged AT1a C-terminus; lane 4, GST–PLZF + His6-tagged AT2 third intracellular loop; lane 5, GST–PLZF + His6-tagged AT2 C-terminus; lane 6, recombinant GST; lane 7, GST + His6-tagged AT2 C-terminus. Each band was visualized by western blot analysis using anti-GST and AT2 C-terminus antibodies.
None
Fig. 2. Rat PLZF.(A) Amino acid sequences of human and rat PLZF. Bold characters indicate amino acid residues different between human and rat. Amino acid sequence identity between human and rat is 96%. Underlining indicates a zinc finger domain. (B) Localization of rat PLZF. Northern blotting was performed using the rat PLZF cDNA as a probe. A 20 µg aliquot of total RNA from various tissues was used.
None
Fig. 3. (A) Translocation of AT2 and PLZF by Ang II stimulation in CHO-K1 cells transfected with AT2 and PLZF. Green fluorescence (EGFP) indicates AT2 or AT1, red fluorescence (rhodamine Red-X) indicates anti-myc (PLZF). CHO-K1 cells were transfected and treated as indicated. Control means without Ang II treatment, and indicated time refers to the duration of Ang II exposure. The green and red channels were used separately for the first row and the second row to visualize AT2 and PLZF separately in the same cells. The third row is the overlay. (B) The nuclear localization of PLZF (anti-myc) in early stage R3T3 cells transfected with PLZF and stimulated with Ang II for 60 min. RB is used as the nuclear marker. (C) Percentage decrease of AT2-binding sites on the cell surface using [125I]Ang II in early stage R3T3 cells transfected with PLZF. Indicated time refers to the duration of Ang II exposure. Data are representative of three independent experiments with nearly identical results. (D) PLZF is associated with epsin 1 before Ang II stimulation. CHO-K1 cells were transfected with AT2 and PLZF. Green fluorescence (EGFP) indicates PLZF, red fluorescence (rhodamine Red-X) indicates anti-epsin. Control is without Ang II treatment, and indicated time refers to the duration of Ang II exposure. Immunoprecipitation was performed with anti-GFP and then western blot was performed with anti-epsin. (E) AT2–PLZF complex did not involve β2-arrestin. CHO-K1 cells were transfected with AT1 alone, or AT2 and PLZF. Green fluorescence (EGFP) indicates AT1 or AT2, red fluorescence (rhodamine Red-X) indicates anti-β2-arrestin. Control is without Ang II treatment, and indicated time refers to the duration of Ang II exposure.
None
Fig. 4. (A) Tyrosine phosphorylation of PLZF and Y669F PLZF at various times after Ang II stimulation in CHO-K1 cells. (B) Y669F PLZF lost the ability to co-localize with AT2 and translocate to the nucleus. Green fluorescence (EGFP) indicates AT2, red fluorescence (rhodamine Red-X) indicates anti-myc (PLZF or Y669F PLZF). CHO-K1 cells were transfected and treated as indicated. Indicated time refers to the duration of Ang II exposure. (C) EMSA using nuclear extracts of rat cardiomyocyte-derived H9C2 cells that express PLZF. The probes are: W, [α-32P]dATP-labeled wild-type probe; m1 or m2, [α-32P]dATP-labeled mutant probes. Cold 10, etc is the excess of cold wild-type or mutant probe added. Nuclear extracts of Cos7 cells that do not express PLZF were used as control. Data are representative of three sets of independent experiments with nearly identical results. (D) Supershift using H9C2 cell nuclear extracts and anti-PLZF antibodies. Lane 1, [α-32P]dATP-labeled wild-type probe; lane 2, [α-32P]dATP-labeled wild type probe + 200-fold excess of cold wild-type probe; lane 3, [α-32P]dATP-labeled wild-type probe + 3 µl of anti-PLZF antibody. Data are representative of three independent experiments with nearly identical results. (E) Luciferase assay using Cos7 cells transfected with AT2 and PLZF permanently. The filled square is a PLZF-binding element. Lane 1, 1.6 kbp of p85αPI3K promoter region that contains the PLZF-binding element; lane 2, 0.8 kbp of p85αPI3K promoter region that contains the PLZF-binding element; lane 3, 0.6 kbp of p85αPI3K promoter region that does not contains the PLZF-binding element; lane 4, 1.6 kbp of p85αPI3K promoter region that contains a mutated PLZF-binding element (T→G: mutant 1); lane 5, 1.6 kbp of p85αPI3K promoter region that contains a mutated PLZF-binding element (T→C: mutant 2). Data are representative of five independent experiments with nearly identical results.
None
Fig. 5. (A) Expression level of p85α PI3K in PLZF-transfected R3T3 cells 1 h after Ang II stimulation. Lanes 1–7, early stage R3T3 cells, which expressed AT2 endogenously. Lane 1, transfection with control vector; lane 2, transfection with control vector with Ang II stimulation; lane 3, transfection with PLZF; lane 4, transfection with PLZF with Ang II stimulation; lane 5, transfection with PLZF and treated with Ang II and PD123319; lane 6, transfection with PLZF and treated with Ang II and PTX; lane 7, transfection with Y669F PLZF with Ang II stimulation; lanes 8 and 9 employed late stage R3T3 cells, which no longer expressed AT2 and were transfected with AT1 and PLZF (lane 8) or AT2 and PLZF (lane 9) as indicated. Each band was visualized by western blot analysis using anti-p85αPI3K. Data are representative of three independent experiments with nearly identical results. ∗P < 0.01. (B) Protein level of p85α PI3K, Akt/PKB and p70S6k in PLZF-transfected R3T3 cells at various times after Ang II stimulation. Early stage R3T3 cells, which expressed AT2 endogenously, were transfected with PLZF in all samples. Each band was visualized by western blot analysis using specific antibodies. Data are representative of three independent experiments with nearly identical results. (C) mRNA of p85α PI3K in PLZF-transfected R3T3 cells at various times after Ang II stimulation. mRNA of Akt/PKB and p70S6k in PLZF-transfected R3T3 cells at 1 h of Ang II stimulation. Each band was visualized by northern blot analysis using a specific probe.
None
Fig. 6. (A) The heart of an AT2-null mouse treated with 4.2 ng/kg/min Ang II for 3 weeks. (B) p85α and p110 PI3K in the wild-type and AT2-null mouse heart. Data are representative of three independent experiments with nearly identical results. ∗P < 0.01. (C) PLZF expression in the Ang II-treated wild-type and AT2-null mouse heart. (a) Cellular localization of PLZF in the mouse heart. The nuclear PLZF is detected in the Ang II-treated-wild type mouse heart. (b) Total PLZF expression in the Ang II-treated wild-type and AT2-null mouse heart. Data are representative of three independent experiments with nearly identical results. (c) Cytosolic or nuclear localization of PLZF in the Ang II-treated wild-type and AT2-null mouse heart as indicated. Non-nuclear indicates cytosol. RB is used as the nuclear marker. Data are representative of three independent experiments with nearly identical results.
None
Fig. 7. [3H]Leucine incorporation into AT2-transfected H9C2 cells. H9C2 cells were transfected with control vector or AT2 and stimulated with Ang II and treated with inhibitors as indicated. Data are representative of four independent experiments with nearly identical results. ∗P < 0.01.

Similar articles

Cited by

References

    1. Albagli O. et al. (1999) Overexpressed BCL6 (LAZ3) oncoprotein triggers apoptosis, delays S phase progression and associates with replication foci. Oncogene. 18, 5063–5075. - PubMed
    1. Barna M., Hawe,N., Niswander,L. and Pandolfi,P.P. (2000) Plzf regulates limb and axial skeletal patterning. Nat. Genet., 25, 166–172. - PubMed
    1. Bedecs K., Elbaz,N., Sutren,M., Masson,M., Susini,C., Strosberg,A.D. and Nahmias,C. (1997) Angiotensin II type 2 receptors mediate inhibition of mitogen-activated protein kinase cascade and functional activation of SHP-1 tyrosine phosphatase. Biochem. J., 325, 449–454. - PMC - PubMed
    1. Chang C.C., Ye,B.H., Chaganti,R.S. and Dalla-Favera,R. (1996) BCL-6, a POZ/zinc-finger protein, is a sequence-specific transcriptional repressor. Proc. Natl Acad. Sci. USA, 93, 6947–6952. - PMC - PubMed
    1. Chen Z., Brand,N.J., Chen,A., Chen,S.J., Tong,J.H., Wang,Z.Y., Waxman,S. and Zelent,A. (1993) Fusion between a novel Kruppel-like zinc finger gene and the retinoic acid receptor-α locus due to a variant t(11;17) translocation associated with acute promyelocytic leukaemia. EMBO J., 12, 1161–1167. - PMC - PubMed

Publication types

MeSH terms

Substances