. 2003 Dec 15;22(24):6526-36.
doi: 10.1093/emboj/cdg620.

Transcriptional activation of known and novel apoptotic pathways by Nur77 orphan steroid receptor

Affiliations

Transcriptional activation of known and novel apoptotic pathways by Nur77 orphan steroid receptor

Arvind Rajpal et al. EMBO J. .

Abstract

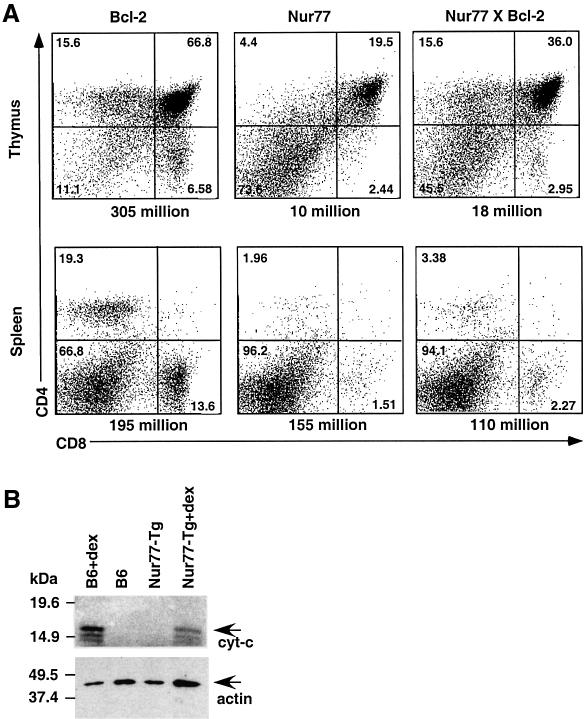
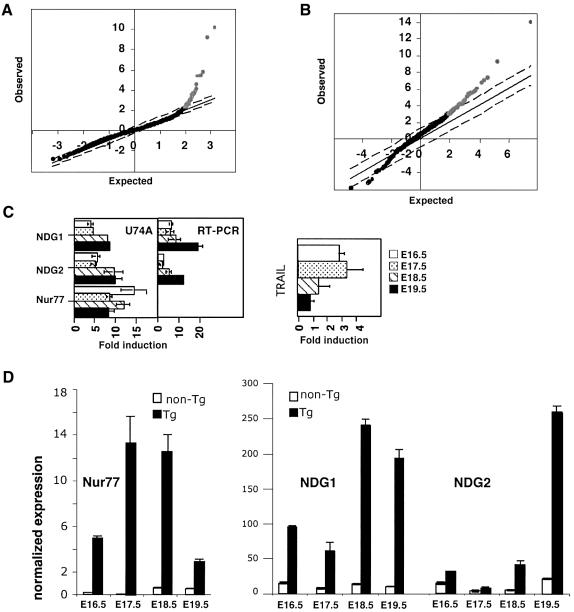
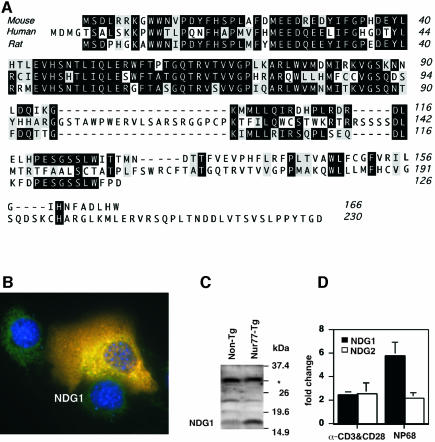
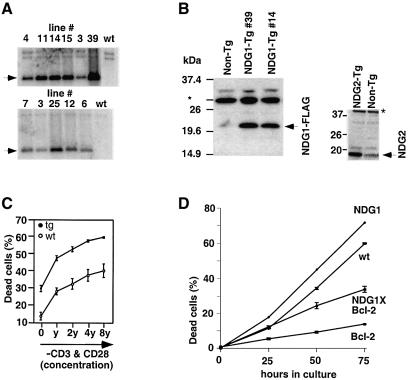
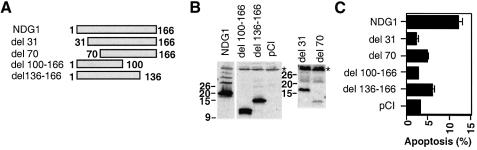
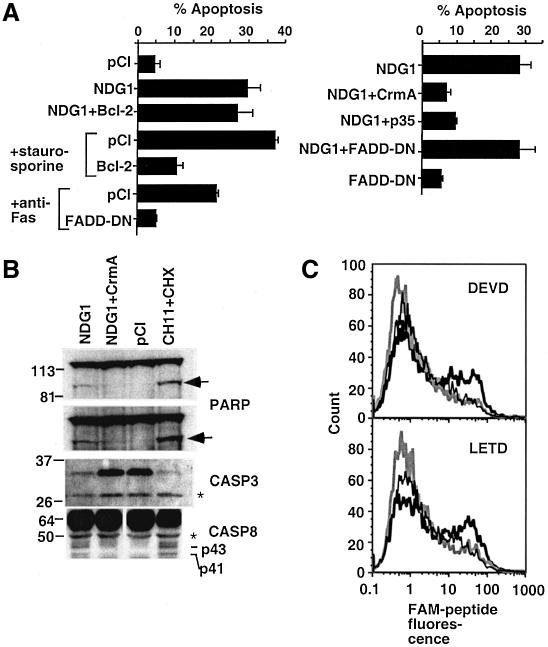
Nur77 is a nuclear orphan steroid receptor that has been implicated in negative selection. Expression of Nur77 in thymocytes and cell lines leads to apoptosis through a mechanism that remains unclear. In some cell lines, Nur77 was reported to act through a transcription-independent mechanism involving translocation to mitochondria, leading to cytochrome c release. However, we show here that Nur77-mediated apoptosis in thymocytes does not involve cytoplasmic cytochrome c release and cannot be rescued by Bcl-2. Microarray analysis shows that Nur77 induces many genes, including two novel genes (NDG1, NDG2) and known apoptotic genes FasL and TRAIL. Characterization of NDG1 and NDG2 indicates that NDG1 initiates a novel apoptotic pathway in a Bcl-2-independent manner. Thus Nur77-mediated apoptosis in T cells involves Bcl-2 independent transcriptional activation of several known and novel apoptotic pathways.


Figures

None
Fig. 1. Nur77-mediated apoptosis in T cells is mitochondria independent. (A) Representative flow cytometric analysis of thymocytes and splenocytes of 5-week-old Bcl-2, Nur77 and Nur77 × Bcl-2 transgenic mice. The cell numbers of the corresponding organs are indicated below each chart. (B) Cytoplasmic fractions of Nur77 transgenic (Nur77-Tg) and C57BL/6 (B6) non-transgenic thymocytes were isolated and blotted with anti-cytochrome c antibodies. Extracts from identical number of thymocytes were loaded. For positive controls, thymocytes were incubated with dexamethasone (dex) for 9 h. The cytochrome c reactive bands are denoted by cyt-c. This experiment was repeated several times with similar results.
None
Fig. 2. Nur77 downstream genes. (A) A SAM plot of the differential expression data obtained from the U74A Affymetrix microarray hybridizations. The genes upregulated at significant levels are shown in gray and the remaining unperturbed genes are shown in black. (B) A SAM plot depicting the analysis of the data obtained with the UCB/UCSF cDNA microarray. (C) A comparison between the U74A hybridization and quantitative RT–PCR analysis of several differentially expressed genes, including quantitative RT–PCR analysis of TRAIL expression levels. Fold induction denotes the ratio of the expression levels between Nur77 transgenic and non-transgenic thymocytes. (D) Quantitative RT–PCR analysis of Nur77, NDG1 and NDG2 between Nur77 transgenic and non-transgenic thymocytes from different days of gestation. The expression is normalized to the actin controls.
None
Fig. 3. NDG1 amino acid alignments, protein expression levels and TCR-mediated induction. (A) A ClustalW alignment of the polypeptide sequences for murine, human and rat NDG1 orthologs. Identical residues are heavily shaded and similar residues are lightly shaded. (B) Subcellular localization of NDG1. NIH3T3 cells were transfected with NDG1 expression construct and stained with NDG1-specific antibodies (red). At the same time, DAPI staining for nuclear (blue) and HSP60 staining for mitochondria (green) in different colors were also performed. (C) Western blot depicting the NDG1 protein expression levels in Nur77 transgenic animals (Nur77-Tg) and littermate cohorts (Non-Tg). The asterisk indicates a non-specific band that serves as a loading control. (D) Upregulation of NDG1 and NDG2 transcript in wild-type thymocytes in response to stimulation by α-CD3 and α-CD28 antibodies in vitro and negatively selecting peptide NP68 injections into F5-TCR transgenic mice. The data were obtained by quantitative RT–PCR and normalized with levels of γ-actin in each sample and shown as fold over PBS control for each condition.
None
Fig. 4. Characterization of transgenic NDG1 and NDG2 mice. (A) Southern blot analysis showing six founders for the NDG1 and five founders for the NDG2 transgene. The wild-type (wt) control shows the endogenous band that also serves as controls in other lanes. (B) The left panel shows western blot analysis of NDG1 transgenic thymocytes from two different founders (39 and 14) detected with NDG1-specific antibodies. The transgenic protein ran higher than the endogenous protein because it was tagged with the C-terminal FLAG tag. The right panelshows western blot analysis of thymocytes from NDG2 transgenic mice (NDG2-Tg) and their non-transgenic (non-Tg) littermates. NDG2 transgenic protein was tagged with C-terminal FLAG tag and was detected by α-FLAG (M2) antibody. the asterisk denotes non-specific binding of the antibodies that serves as a loading control. (C) Apoptosis of transgenic and littermate neonatal DP thymocytes in response to in vitro α-CD3 and α-CD28 stimulation. The antibodies were originally diluted to 1:1000 and 1:50, respectively, to yield the highest concentration point (8y) and serial diluted 2-fold three times to obtain the other points (4y, 2y and y). (D) Time course of spontaneous apoptosis of DP thymocytes from wild-type (wt), NDG1, Bcl-2 and NDG1 × Bcl-2 transgenic mice. All the experiments were done at least three times.
None
Fig. 5. Induction of apoptosis by N- and C-terminal truncation mutants of NDG1 in 293T cells. (A) A schematic diagram showing the regions of NDG1 that were truncated to generate a panel of NDG1 variants. An initiating Met codon was included at the N-terminus of the del 31 and 70 mutants. (B) Expression levels of the truncation mutants in transiently transfected 293T cells were analyzed by immunoblotting with anti-FLAG antibodies. (C) Induction of apoptosis by the truncation and full-length variants of NDG1. Apoptosis was scored by obtaining a ratio of punctated DAPI stained cells and the total number of GFP positive cells. For each time point, >200 cells were scored.
None
Fig. 6. The role of caspases in NDG1-mediated apoptosis. (A) Apoptosis of 293T cells transiently cotransfected with NDG1 and anti-apoptotic molecules was measured by the ratio of punctated DAPI stained cells to the total number of GFP-positive cells. For controls, staurosporine or anti-Fas antibody was added to the cells to initiate a Bcl-2- or FADD-dependent apoptosis. (B) Western blots indicating the activation of caspases and cleavage of downstream target PARP. Total lysates from transiently transfected 293T cells were analyzed by western blotting. Two exposures of the gel are shown and the arrow indicates the cleaved PARP product while the larger molecular weight band indicates the full-length species. Levels of the cotransfected full-length caspase-3 (CASP3) are greatly diminished in cells transfected with NDG1 and those treated with anti-Fas antibody and cycloheximide. Caspase-8 activation in NDG1-transfected and α-Fas-treated cells as depicted by the generation of p43 and p41 cleaved product of caspase-8. The asterisk indicates a non-specific band that serves as a loading control. (C) Activation of caspase-3 and caspase-8 was assessed by fluorescent labeling of 293T cells with FAM-labeled substrates. 293T cells transfected with NDG1 (bold black line) or cotransfected with NDG1 and CrmA (bold gray line) or CI (thin black line) were stained with FAM-labeled substrates for caspase-3 (DEVD) and caspase-8 (LETD) 48 h after transfection.

Similar articles

Cited by

References

    1. Abraham K.M., Levin,S.D., Marth,J.D., Forbush,K.A. and Perlmutter,R.M. (1991) Thymic tumorigenesis induced by overexpression of p56lck. Proc. Natl Acad. Sci. USA, 88, 3977–3981. - PMC - PubMed
    1. Allen J.M., Forbush,K.A. and Perlmutter,R.M. (1992a) Functional dissection of the lck proximal promoter. Mol. Cell. Biol., 12, 2758–2768. - PMC - PubMed
    1. Allen J.M., Forbush,K.A. and Perlmutter,R.M. (1992b) Functional dissection of the lck proximal promoter. Mol. Cell. Biol., 12, 2758–2768. - PMC - PubMed
    1. Bateman A., Birney,E., Cerruti,L., Durbin,R., Etwiller,L., Eddy,S.R., Griffiths-Jones,S., Howe,K.L., Marshall,M. et al. (2002) The Pfam protein families database. Nucleic Acids Res., 30, 276–280. - PMC - PubMed
    1. Breckenridge D.G., Nguyen,M., Kuppig,S., Reth,M. and Shore,G.C. (2002) The procaspase-8 isoform, procaspase-8L, recruited to the BAP31 complex at the endoplasmic reticulum. Proc. Natl Acad. Sci. USA, 99, 4331–4336. - PMC - PubMed

Publication types

MeSH terms