. 2003 Dec 3;23(35):11167-77.
doi: 10.1523/JNEUROSCI.23-35-11167.2003.

Neuronal avalanches in neocortical circuits

Affiliations

Neuronal avalanches in neocortical circuits

John M Beggs et al. J Neurosci. .

Abstract

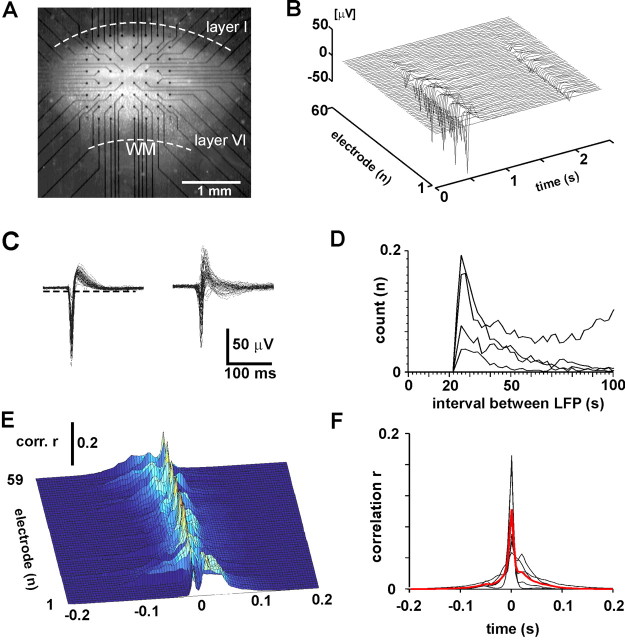
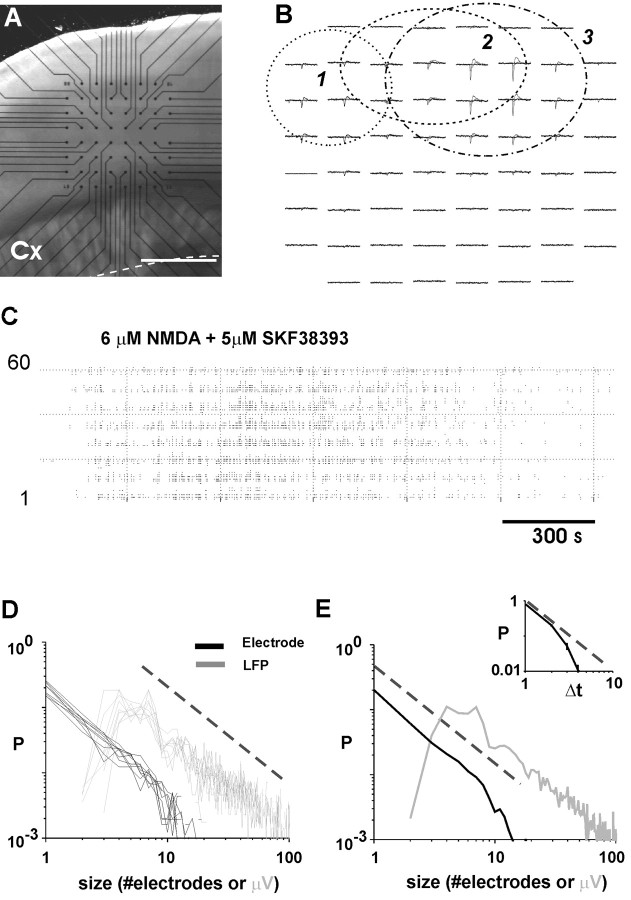
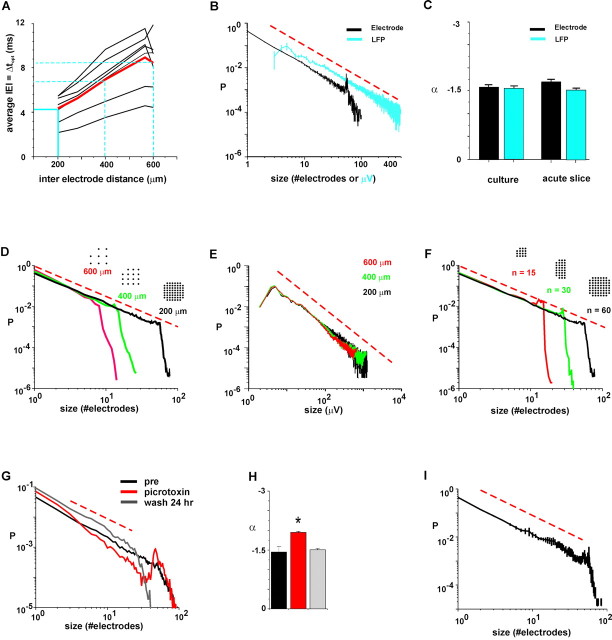
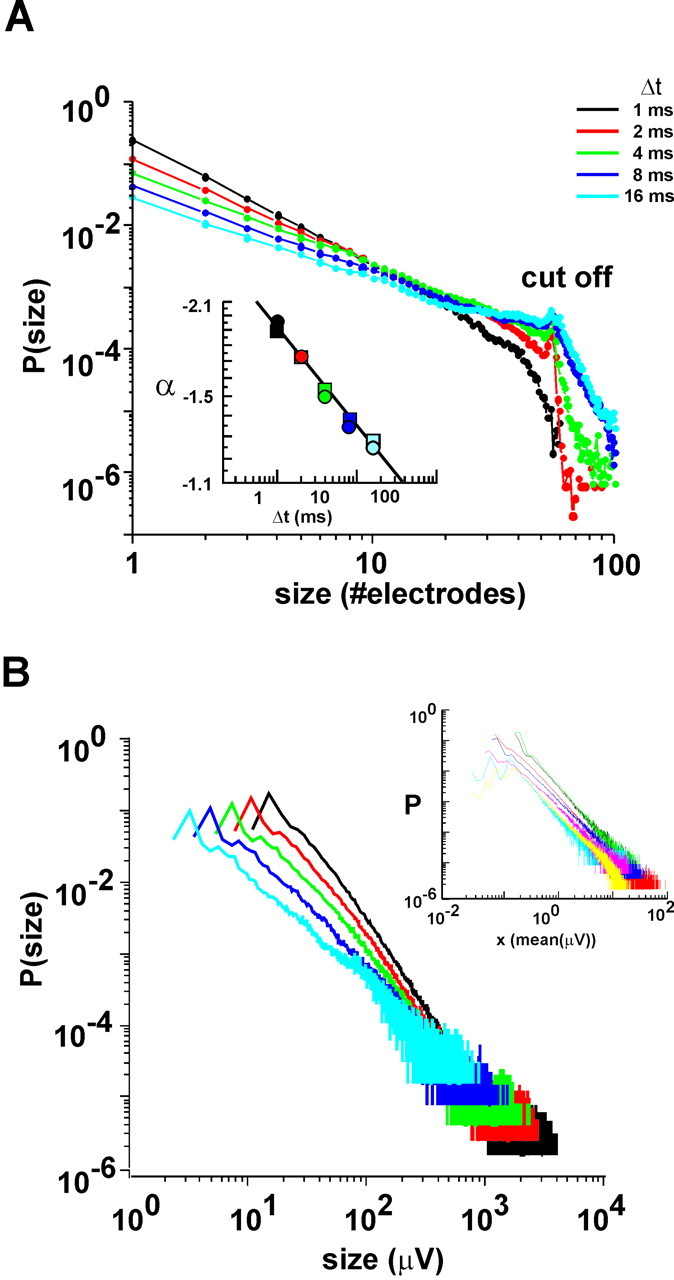
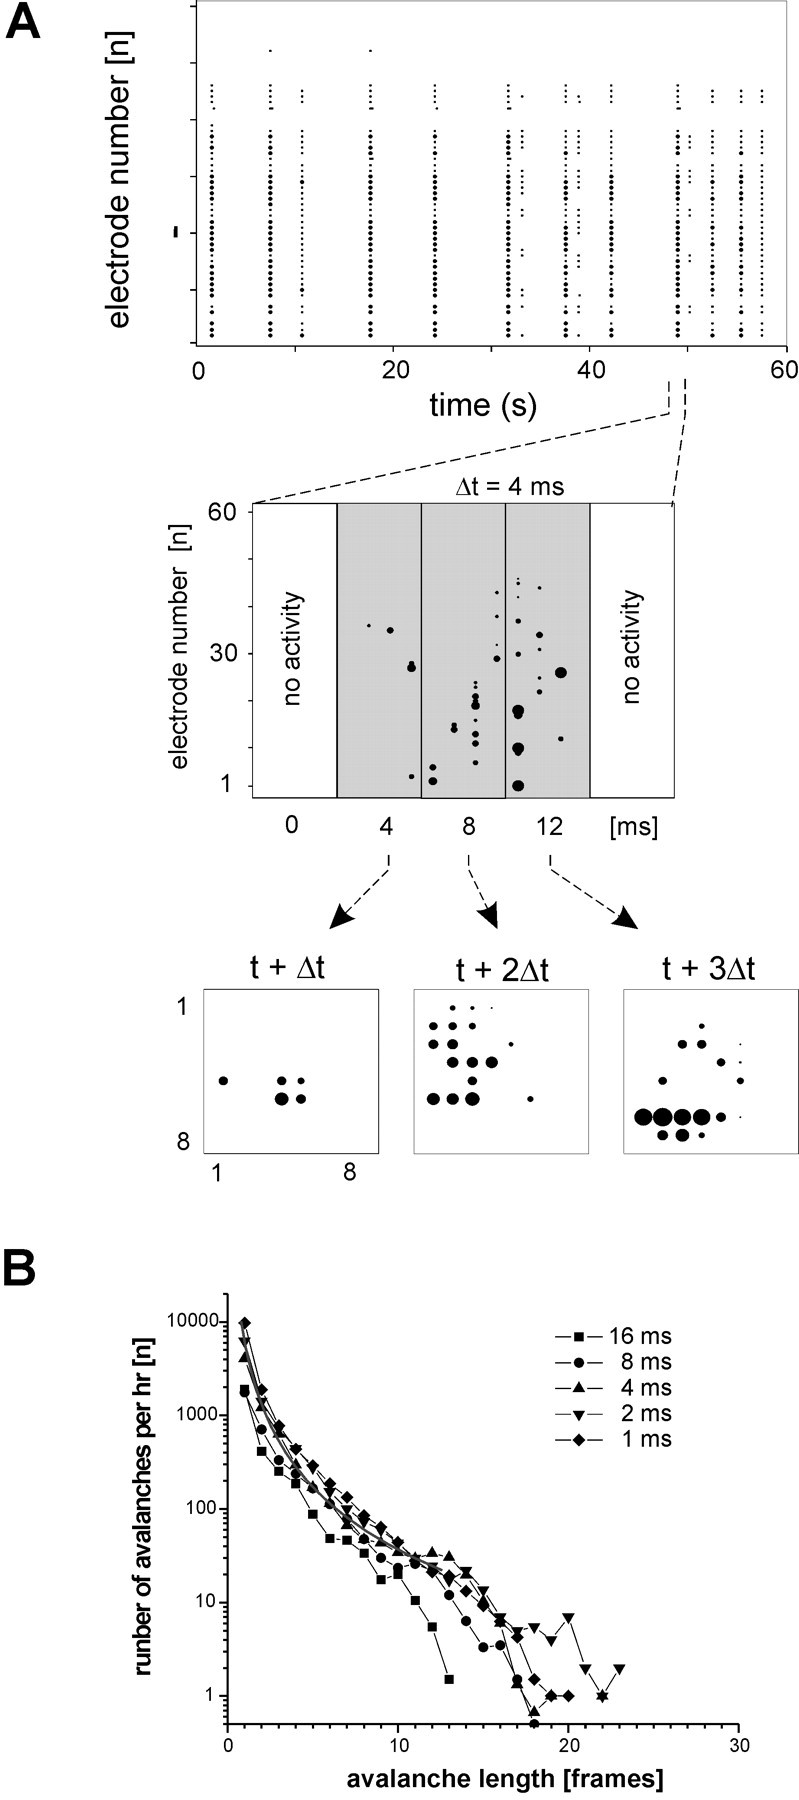
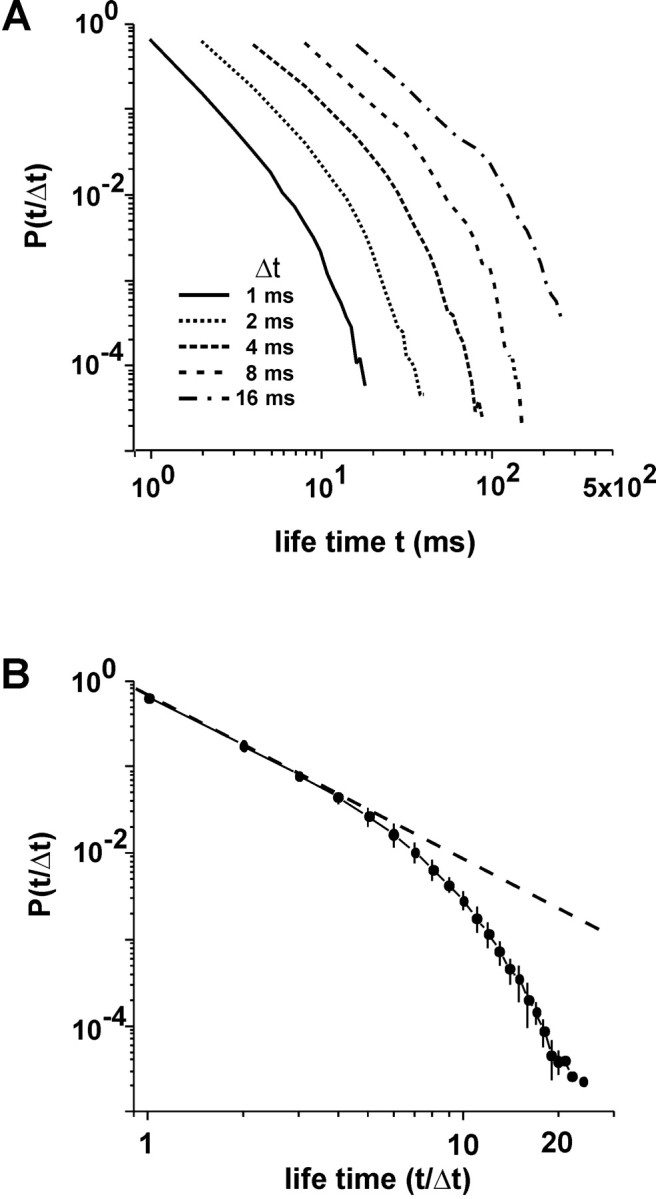
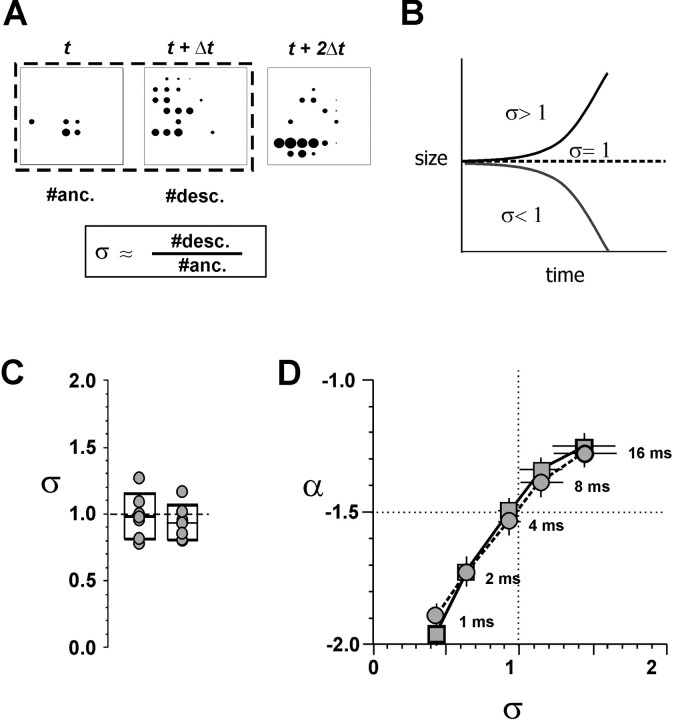
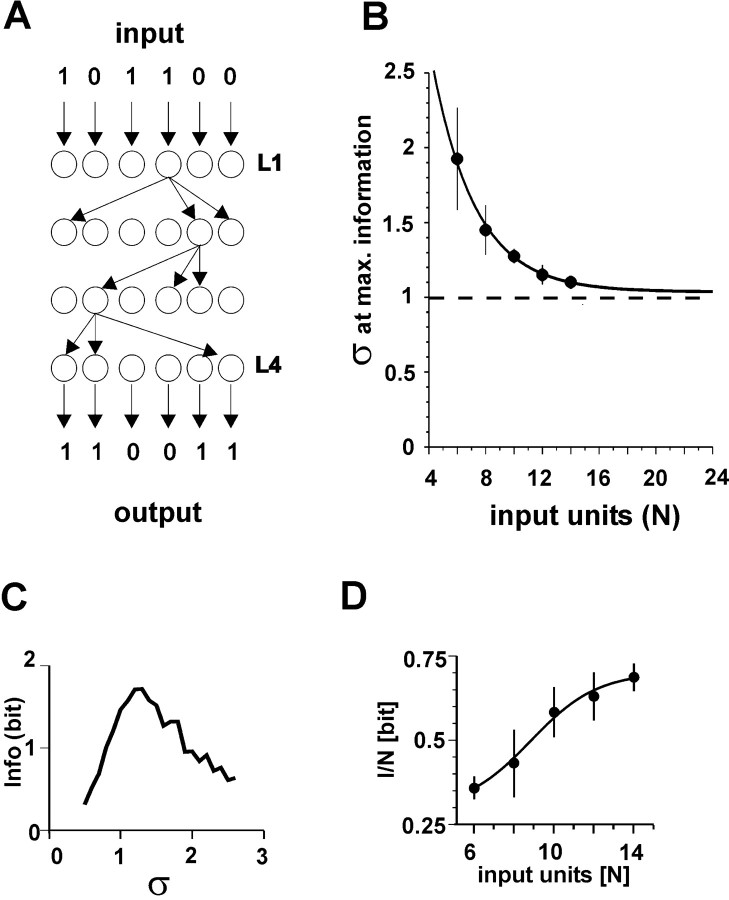
Networks of living neurons exhibit diverse patterns of activity, including oscillations, synchrony, and waves. Recent work in physics has shown yet another mode of activity in systems composed of many nonlinear units interacting locally. For example, avalanches, earthquakes, and forest fires all propagate in systems organized into a critical state in which event sizes show no characteristic scale and are described by power laws. We hypothesized that a similar mode of activity with complex emergent properties could exist in networks of cortical neurons. We investigated this issue in mature organotypic cultures and acute slices of rat cortex by recording spontaneous local field potentials continuously using a 60 channel multielectrode array. Here, we show that propagation of spontaneous activity in cortical networks is described by equations that govern avalanches. As predicted by theory for a critical branching process, the propagation obeys a power law with an exponent of -3/2 for event sizes, with a branching parameter close to the critical value of 1. Simulations show that a branching parameter at this value optimizes information transmission in feedforward networks, while preventing runaway network excitation. Our findings suggest that "neuronal avalanches" may be a generic property of cortical networks, and represent a mode of activity that differs profoundly from oscillatory, synchronized, or wave-like network states. In the critical state, the network may satisfy the competing demands of information transmission and network stability.


Figures

Figure 1.
Figure 1.
Spontaneous, correlated neuronal activity in organotypic cortex cultures. A, Organotypic coronal cortex slice culture on 8 × 8 multielectrode array (IED, 200 μm). WM, White matter. B, Spontaneous LFP from 60 electrodes (linear order) with two periods of correlated activity. C, Overplot of LFPs from a single electrode (left, ∼1 min spontaneous activity) and from all electrodes during one correlated period of activity (right, aligned to negative peaks). Note typical negative peaks riding on a longer-lasting depolarization. Broken line, -3 SD. D, Successive LFPs on individual electrodes are >20 msec apart in time. Average time interval distributions for successive LFPs on one electrode for four representative cultures (1 hr spontaneous activity). E, Representative cluster of 59 cross-correlation functions for one electrode in relation to all other electrodes (single culture). F, Population cross-correlogram shows correlation falls to zero within ± 100-200 msec. red, Average; black, individual cultures.
Figure 6.
Figure 6.
Neuronal avalanches in acute cortex slices. A, Light microscopic picture of the acute coronal brain slice and position of the microelectrode array. Cx, Cortex. B, Overplot of three different periods in which spontaneous, synchronized LFPs are visible. Three different periods (1-3) are shown (1 sec each) that reveal the occurrence of neuronal avalanches in three different, partially overlapping locations. For spatial location in the slice, see A. C, Raster plot of LFP activity in response to bath application of the NMDA receptor agonist NMDA and the D1 receptor agonist SKF-38393. Note that synchronized events are visible across the array for ∼2000 sec after which the activity subsides. D, Individual event size distribution at Δt = IEIavg from each acute slice experiment over plotted (n = 9 acute slices). Black, Number of electrodes; gray, summed LFPs; broken line, power law with α = -3/2). E, Average event size distribution from data shown in D. Inset, Lifetime distributions of avalanches display a power law in initial portion with characteristic slope of -2 and exponential cutoff. Broken line, Power law with exponent of α = -2.
Figure 4.
Figure 4.
Characteristic exponent for neuronal avalanche sizes is -3/2. A, IED versus IEIavg for original and rescaled grid sizes. Red, Average; black, individual cultures. B, Power laws at Δt = IEIavg for each culture have characteristic exponent α ≈ -1.5. Black, Number of electrodes; blue, LFP; average for all cultures. C, Average slopes for cultures (left) and acute slices (right). D, At Δt = IEIavg and corresponding IED, the slope α is independent of array size. Icons indicate resampled arrays at IED = 200, 400, and 600 μm. E, Resampled power laws for summed LFP values (same arrays as in D). F, Cutoff point of the power law is determined by the number of electrodes in the array (n = 15, 30, 60; IED = 200 μm). G, Reduction in inhibition in the presence of the GABAA receptor antagonist picrotoxin destroys the power law and renders the event size distribution bimodal. Note the presence of a large hump at higher values, indicating epileptic discharge. H, The initial slope of the event size distribution is significantly steeper (p < 0.05) in the presence of picrotoxin. Same color code as in G. I, Average event size distribution for refractory period set to 0 msec at Δt = 4 msec (three cultures). Broken line in red indicates slope of -3/2.
Figure 3.
Figure 3.
Size distributions for avalanches follow power laws independently of bin width Δt. A, Probability distribution of avalanche sizes (number of electrodes activated) in log-log coordinates at different Δt (average for n = 7 cultures). The linear part of each function indicates power law. Cutoff given by maximal number of electrodes (n = ∼60). Inset, Dependence of slope α on Δt: α(Δt) ∼ Δt-0.16 ± 0.01 (R2 = 0.99 ± 0.01; averages for all cultures). Circles, Electrodes; squares, LFP. B, Probability distribution of avalanche size distributions based on summed LFPs as a function of bin width Δt. Inset, Single culture; overplot of power laws for all seven cultures at Δt = 1 msec expressed in multiples of average LFP size.
Figure 2.
Figure 2.
Activity within synchronized periods is composed of avalanches. A, Raster of spontaneous activity (top) shows correlated periods containing spatiotemporal patterns (middle) and an avalanche of three frames in the original coordinates of the multielectrode array (bottom). Avalanches were defined as sequences of continuous activity that were preceded and terminated by a bin width of Δt with no activity. Dots, LFP times (dot sizes proportional to LFP amplitudes); 1 and 8, columns and rows on the grid. B, Cultured cortical networks produce thousands of avalanches of different durations per hour.
Figure 5.
Figure 5.
Lifetime distributions of avalanches display a power law in initial portion with characteristic slope of -2 and exponential cutoff. A, Lifetime distributions as a function of bin width Δt. B, Normalized time tt collapsed from inset giving scale-invariant lifetime distributions (average for Δt = 1, 2, 4, 8, and 16 msec for n = 7 cultures). Broken line indicates slope of -2.
Figure 7.
Figure 7.
Network dynamics in cultured networks are characterized by a critical branching parameter of σ = 1, suggesting a state of optimal information transmission. A, Estimate of branching parameter σ from individual avalanches. σ = the ratio of descendant electrodes to ancestor electrodes. B, Sketch depicting the critical behavior of a branching process over time. If σ > 1, the size of the avalanche will grow over time, taking over the network (epilepsy), whereas at σ < 1, the avalanche will diminish quickly in size. Only at σ = 1 (critical) can avalanches persist at all scales. C, Values of σ for individual cultures (circles) based on single ancestor (left) or multiple ancestor (right) calculations. Boxes, Means ± SD. D, Phase plot of (σ, α) as a function of Δt. Note that the trajectory passes through critical point (1,-1.5) at the average population IEI of 4.2 msec. σ calculated from single ancestor avalanches. Circles, LFPs; squares, number of electrodes; ± SE.
Figure 8.
Figure 8.
Critical branching parameter of σ = 1 suggests a state of optimal information transmission in feedforward networks. A, Example of feedforward network with connections removed for clarity, except for one neuron/layer. B, Branching parameter σ that optimizes information transmission approaches 1 for increasing network sizes. Exponential fit for all networks tested (L = 3, 4; C = 2, 3; R2 = 0.99). C, Transmitted information (Info) peaks near σ = 1 (one network with N = 8, L = 4, C = 3). D, Change in transmitted information with increase in total number of input units.

References

    1. Abeles M ( 1992) Corticonics. New York: Cambridge UP.
    1. Aertsen A, Diesmann M, Gewaltig MO ( 1996) Propagation of synchronous spiking activity in feedforward neural networks. J Physiol (Paris) 90: 243-247. - PubMed
    1. Arieli A ( 1992) Novel strategies to unravel mechanisms of cortical function: from macro- to micro-electrophysiological recordings. In: Information processing in the cortex (Aertsen A, Braitenberg V, eds), pp 123-137. New York: Springer.
    1. Bak P, Tang C, Wiesenfeld K ( 1987) Self-organized criticality: an explanation of the 1/f noise. Phys Rev Lett 59: 381-384. - PubMed
    1. Bove M, Genta G, Verreschi G, Grattarola M ( 1996) Characterization and interpretation of electrical signals from random networks of cultured neurons. Technol Health Care 4: 77-86. - PubMed