. 2003 Dec 1;198(11):1677-88.
doi: 10.1084/jem.20030932.

Alveolar macrophage-mediated killing of Pneumocystis carinii f. sp. muris involves molecular recognition by the Dectin-1 beta-glucan receptor

Affiliations

Alveolar macrophage-mediated killing of Pneumocystis carinii f. sp. muris involves molecular recognition by the Dectin-1 beta-glucan receptor

Chad Steele et al. J Exp Med. .

Abstract

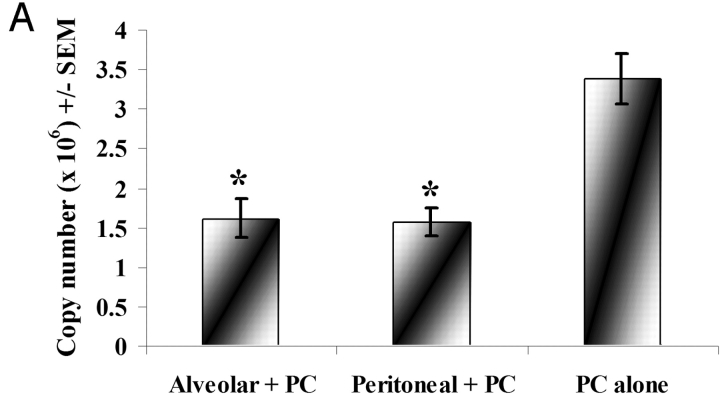
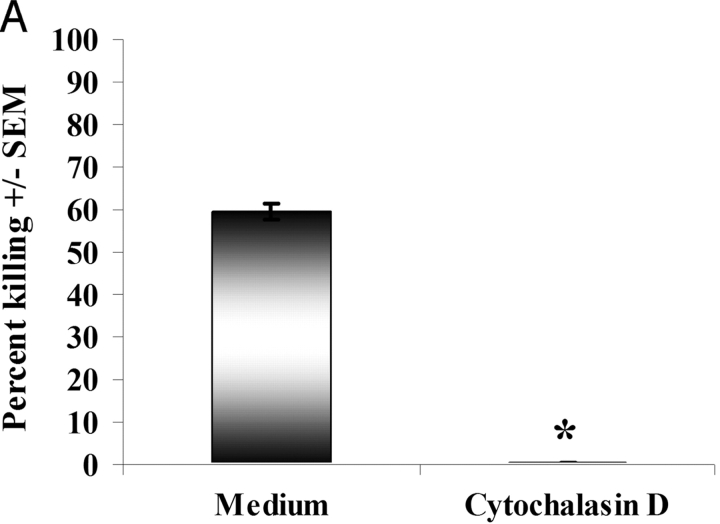
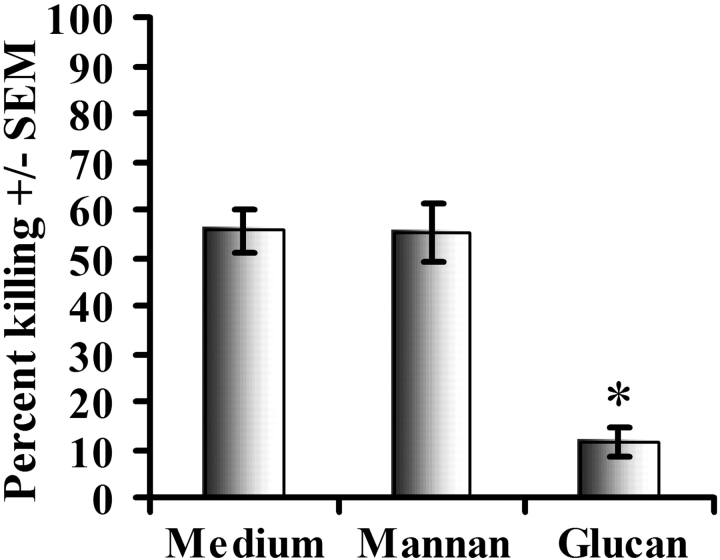
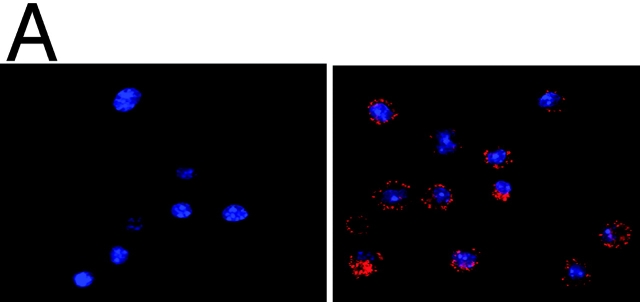
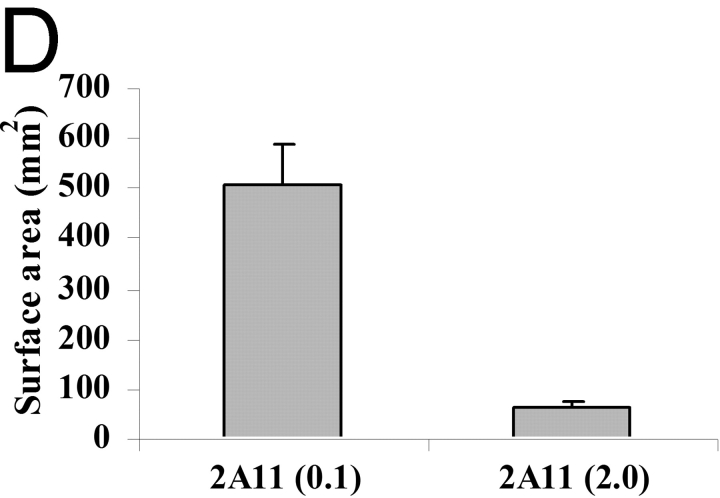
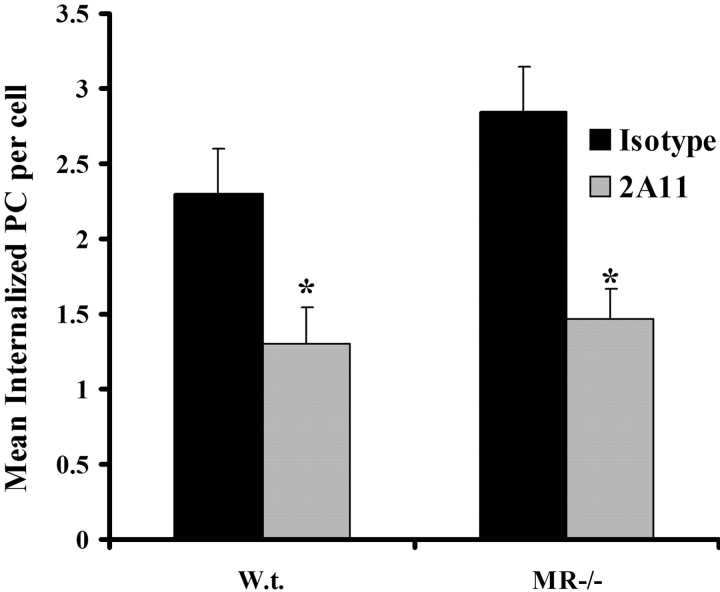
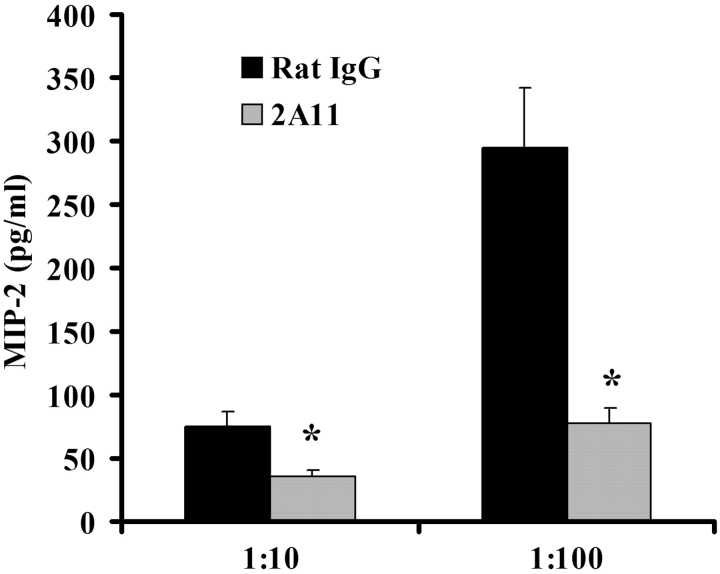
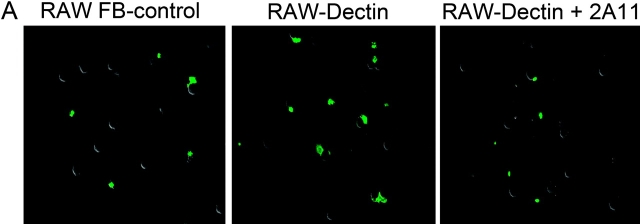
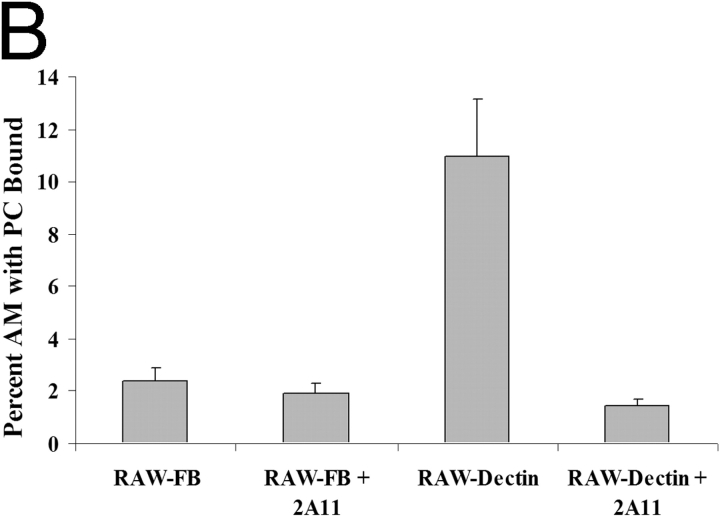
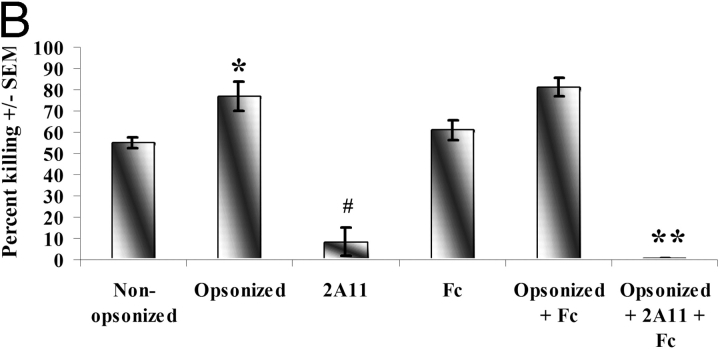
Innate immune mechanisms against Pneumocystis carinii, a frequent cause of pneumonia in immunocompromised individuals, are not well understood. Using both real time polymerase chain reaction as a measure of organism viability and fluorescent deconvolution microscopy, we show that nonopsonic phagocytosis of P. carinii by alveolar macrophages is mediated by the Dectin-1 beta-glucan receptor and that the subsequent generation of hydrogen peroxide is involved in alveolar macrophage-mediated killing of P. carinii. The macrophage Dectin-1 beta-glucan receptor colocalized with the P. carinii cyst wall. However, blockage of Dectin-1 with high concentrations of anti-Dectin-1 antibody inhibited binding and concomitant killing of P. carinii by alveolar macrophages. Furthermore, RAW 264.7 macrophages overexpressing Dectin-1 bound P. carinii at a higher level than control RAW cells. In the presence of Dectin-1 blockage, killing of opsonized P. carinii could be restored through FcgammaRII/III receptors. Opsonized P. carinii could also be efficiently killed in the presence of FcgammaRII/III receptor blockage through Dectin-1-mediated phagocytosis. We further show that Dectin-1 is required for P. carinii-induced macrophage inflammatory protein 2 production by alveolar macrophages. Taken together, these results show that nonopsonic phagocytosis and subsequent killing of P. carinii by alveolar macrophages is dependent upon recognition by the Dectin-1 beta-glucan receptor.


Figures

Figure 1.
Figure 1.
Reduction in P. carinii viability during coculture with alveolar and peritoneal macrophages. Alveolar or peritoneal macrophages were isolated from 6–8-wk-old, male C57BL/6 mice and cocultured overnight with a constant number of P. carinii organisms. Controls included P. carinii cultured in the absence of macrophages. Thereafter, RNA was isolated from the contents of each well and quantitative real time PCR for P. carinii rRNA copy number was performed. Cumulative results from six separate experiments for P. carinii rRNA copy number (A) and percent killing (B) are shown. *, significant differences between alveolar macrophages or peritoneal macrophages compared with P. carinii (PC) alone (P = 0.0013 and 0.0017 for alveolar and peritoneal macrophages, respectively; A). Data are expressed as mean copy number (A) or mean percent killing (B) ± SEM.
Figure 1.
Figure 1.
Reduction in P. carinii viability during coculture with alveolar and peritoneal macrophages. Alveolar or peritoneal macrophages were isolated from 6–8-wk-old, male C57BL/6 mice and cocultured overnight with a constant number of P. carinii organisms. Controls included P. carinii cultured in the absence of macrophages. Thereafter, RNA was isolated from the contents of each well and quantitative real time PCR for P. carinii rRNA copy number was performed. Cumulative results from six separate experiments for P. carinii rRNA copy number (A) and percent killing (B) are shown. *, significant differences between alveolar macrophages or peritoneal macrophages compared with P. carinii (PC) alone (P = 0.0013 and 0.0017 for alveolar and peritoneal macrophages, respectively; A). Data are expressed as mean copy number (A) or mean percent killing (B) ± SEM.
Figure 2.
Figure 2.
Alveolar macrophage–mediated killing of P. carinii requires phagocytosis and generation of reactive oxygen species. Alveolar macrophages were isolated from 6–8-wk-old, male C57BL/6 mice and were pretreated with 10 μM cytochalasin D for 30 min at 37°C, washed, and cocultured overnight with P. carinii at a macrophage to P. carinii cyst ratio of 100:1 (A). Controls included P. carinii cultured in the absence of macrophages. In B, an in vitro phagocytosis assay was performed with alveolar macrophages and FITC-labeled P. carinii. A representative micrograph (×630) shows phagocytosis of P. carinii cyst and trophozoite forms (red arrows). Blue indicates DAPI-stained nucleic acid, green indicates FITC on the P. carinii surface, and red indicates phalloidin staining for F-actin. In C, alveolar macrophages were cocultured overnight with P. carinii at a macrophage to PC cyst ratio of 100:1 in the presence of 100 μM MnTMPyP, 5,000 U/ml catalase, 1 mM Nω-nitro-L-arginine methyl ester (L-NAME), or 100 and 10 μM hydrogen peroxide. Controls include P. carinii cultured in the absence of macrophages but in the presence of each compound separately. Thereafter, RNA was isolated from the contents of each well and quantitative real time PCR for P. carinii rRNA copy number was performed. Cumulative results from four separate experiments (A and C) are shown. *, significant differences between untreated and cytochalasin D–treated alveolar macrophages (P = 0.003; A) and untreated and catalase-treated alveolar macrophages (P = 0.005; C). Data are expressed as mean percent killing ± SEM.
Figure 2.
Figure 2.
Alveolar macrophage–mediated killing of P. carinii requires phagocytosis and generation of reactive oxygen species. Alveolar macrophages were isolated from 6–8-wk-old, male C57BL/6 mice and were pretreated with 10 μM cytochalasin D for 30 min at 37°C, washed, and cocultured overnight with P. carinii at a macrophage to P. carinii cyst ratio of 100:1 (A). Controls included P. carinii cultured in the absence of macrophages. In B, an in vitro phagocytosis assay was performed with alveolar macrophages and FITC-labeled P. carinii. A representative micrograph (×630) shows phagocytosis of P. carinii cyst and trophozoite forms (red arrows). Blue indicates DAPI-stained nucleic acid, green indicates FITC on the P. carinii surface, and red indicates phalloidin staining for F-actin. In C, alveolar macrophages were cocultured overnight with P. carinii at a macrophage to PC cyst ratio of 100:1 in the presence of 100 μM MnTMPyP, 5,000 U/ml catalase, 1 mM Nω-nitro-L-arginine methyl ester (L-NAME), or 100 and 10 μM hydrogen peroxide. Controls include P. carinii cultured in the absence of macrophages but in the presence of each compound separately. Thereafter, RNA was isolated from the contents of each well and quantitative real time PCR for P. carinii rRNA copy number was performed. Cumulative results from four separate experiments (A and C) are shown. *, significant differences between untreated and cytochalasin D–treated alveolar macrophages (P = 0.003; A) and untreated and catalase-treated alveolar macrophages (P = 0.005; C). Data are expressed as mean percent killing ± SEM.
Figure 3.
Figure 3.
Effects of mannose and β-glucan receptor blockage on alveolar macrophage–mediated killing of P. carinii. Alveolar macrophages were isolated from 6–8-wk-old, male C57BL/6 mice and were pretreated with 100–600 μg/ml mannan or glucan for 30 min and thereafter added to P. carinii overnight at a final macrophage to P. carinii cyst ratio of 100:1. Controls include P. carinii cultured in the absence of macrophages but in the presence of mannan or glucan. Thereafter, RNA was isolated from the contents of each well and quantitative real time PCR for P. carinii rRNA copy number was performed. Cumulative results from four separate experiments are shown. *, significant differences between untreated and glucan-treated alveolar macrophages (P = 0.008). Data are expressed as mean percent killing ± SEM.
Figure 4.
Figure 4.
The role of the Dectin-1 β-glucan receptor in alveolar macrophage–mediated killing of P. carinii. Alveolar macrophages were isolated from 6–8-wk-old, male C57BL/6 mice and were adhered to glass coverslips. Thereafter, alveolar macrophages were stained with rat IgG (left) or the anti–Dectin-1 antibody 2A11 (right) and imaged using fluorescent deconvolution microscopy. Blue indicates DAPI-stained nucleic acid and red indicates positive Dectin-1 staining (A; ×400). In B, alveolar macrophages were pretreated with 2 μg/ml rat IgG or 2A11 for 30 min at 37°C and thereafter cocultured with P. carinii at a macrophage to P. carinii cyst ratio of 100:1. Thereafter, RNA was isolated from the contents of each well and quantitative real time PCR for P. carinii rRNA copy number was performed. *, significant differences between macrophages incubated in rat IgG or 2A11 (P < 0.0001). Data are expressed as mean percent killing ± SEM. In C, an in vitro binding assay was performed with alveolar macrophages prelabeled with low (0.1 μg/ml; left) and high (2.0 μg/ml; right) concentrations of 2A11 and FITC-labeled P. carinii. Blue indicates DAPI-stained nucleic acid, green indicates FITC on the P. carinii surface, and red indicates Dectin-1 (×200). In D, Slidebook™ analysis software algorithms were used to calculate macrophage surface area that was bound with P. carinii between alveolar macrophages pretreated with low (0.1 μg/ml; C, left) and high (2.0 μg/ml; C, right) concentrations of 2A11. In E, pseudocolor rendering analysis was performed by Slidebook™ analysis software to determine colocalization of Dectin-1 and the P. carinii cell wall (green/yellow area between two gray nuclei; left, alveolar macrophage; right, P. carinii cyst; ×630).
Figure 4.
Figure 4.
The role of the Dectin-1 β-glucan receptor in alveolar macrophage–mediated killing of P. carinii. Alveolar macrophages were isolated from 6–8-wk-old, male C57BL/6 mice and were adhered to glass coverslips. Thereafter, alveolar macrophages were stained with rat IgG (left) or the anti–Dectin-1 antibody 2A11 (right) and imaged using fluorescent deconvolution microscopy. Blue indicates DAPI-stained nucleic acid and red indicates positive Dectin-1 staining (A; ×400). In B, alveolar macrophages were pretreated with 2 μg/ml rat IgG or 2A11 for 30 min at 37°C and thereafter cocultured with P. carinii at a macrophage to P. carinii cyst ratio of 100:1. Thereafter, RNA was isolated from the contents of each well and quantitative real time PCR for P. carinii rRNA copy number was performed. *, significant differences between macrophages incubated in rat IgG or 2A11 (P < 0.0001). Data are expressed as mean percent killing ± SEM. In C, an in vitro binding assay was performed with alveolar macrophages prelabeled with low (0.1 μg/ml; left) and high (2.0 μg/ml; right) concentrations of 2A11 and FITC-labeled P. carinii. Blue indicates DAPI-stained nucleic acid, green indicates FITC on the P. carinii surface, and red indicates Dectin-1 (×200). In D, Slidebook™ analysis software algorithms were used to calculate macrophage surface area that was bound with P. carinii between alveolar macrophages pretreated with low (0.1 μg/ml; C, left) and high (2.0 μg/ml; C, right) concentrations of 2A11. In E, pseudocolor rendering analysis was performed by Slidebook™ analysis software to determine colocalization of Dectin-1 and the P. carinii cell wall (green/yellow area between two gray nuclei; left, alveolar macrophage; right, P. carinii cyst; ×630).
Figure 5.
Figure 5.
Internalization of P. carinii by alveolar macrophages collected from macrophage MR-deficient (MR−/−) mice. Alveolar macrophages were isolated from 6–8-wk-old, male C57BL/6 or MR−/− mice and pretreated with 2.0 μg/ml 2A11 (gray bars) or isotype control antibody (solid bars). Alexa Fluor 488 succinimidyl ester–labeled P. carinii cysts and trophozoites were added at a macrophage to P. carinii ratio of 1:5 in an in vitro phagocytosis assay. Thereafter, aliquots of macrophage/P. carinii cocultures were subjected to confocal microscopy for determination of P. carinii internalization. *, significant differences between cocultures of isotype and 2A11 (P < 0.05). Data are expressed as the mean number of internalized P. carinii organisms per alveolar macrophage.
Figure 6.
Figure 6.
MIP-2 production by alveolar macrophages in response to P. carinii is mediated by Dectin-1. Alveolar macrophages were isolated from 6–8-wk-old, male C57BL/6 mice and cocultured for 16 h in the presence of rat IgG or 2A11 with P. carinii at macrophage to total P. carinii organism ratios of 1:10 and 1:100. Controls included alveolar macrophages cultured in medium alone. Thereafter, MIP-2 concentrations in coculture supernatants were determined by ELISA. Cumulative results from four separate experiments are shown. *, significant differences between cocultures of rat IgG and 2A11 (P < 0.05 and P = 0.011 for 1:10 and 1:100, respectively). Data are expressed as mean MIP-2 pg/ml ± SEM.
Figure 7.
Figure 7.
P. carinii binding and MIP-2 production by RAW 264.7 macrophages overexpressing Dectin-1. In A, an in vitro binding assay was performed with RAW-FB or RAW-Dectin macrophages prelabeled with an isotype control antibody or 2.0 μg/ml 2A11 and FITC-labeled P. carinii. Slidebook™ analysis software was used to capture, deconvolve, and superimpose FITC-P. carinii images with Nomarski macrophage images. In B, numbers of macrophages bound with P. carinii were enumerated using Slidebook™ software. In C, RAW-FB or RAW-Dectin macrophages were cocultured for 16 h in the presence of rat IgG or 2A11 with P. carinii at a macrophage to total P. carinii organism ratio of 1:100. Controls included macrophages cultured in medium alone. Thereafter, MIP-2 concentrations in coculture supernatants were determined by ELISA. Cumulative results from three separate experiments are shown. *, significant differences between cocultures of rat IgG and 2A11 (P < 0.05). Data are expressed as mean MIP-2 pg/ml ± SEM.
Figure 7.
Figure 7.
P. carinii binding and MIP-2 production by RAW 264.7 macrophages overexpressing Dectin-1. In A, an in vitro binding assay was performed with RAW-FB or RAW-Dectin macrophages prelabeled with an isotype control antibody or 2.0 μg/ml 2A11 and FITC-labeled P. carinii. Slidebook™ analysis software was used to capture, deconvolve, and superimpose FITC-P. carinii images with Nomarski macrophage images. In B, numbers of macrophages bound with P. carinii were enumerated using Slidebook™ software. In C, RAW-FB or RAW-Dectin macrophages were cocultured for 16 h in the presence of rat IgG or 2A11 with P. carinii at a macrophage to total P. carinii organism ratio of 1:100. Controls included macrophages cultured in medium alone. Thereafter, MIP-2 concentrations in coculture supernatants were determined by ELISA. Cumulative results from three separate experiments are shown. *, significant differences between cocultures of rat IgG and 2A11 (P < 0.05). Data are expressed as mean MIP-2 pg/ml ± SEM.
Figure 8.
Figure 8.
The effects of Dectin-1 blockage in the presence of FcγRII/III-mediated phagocytosis. Alveolar macrophages were isolated from 6–8-wk-old, male C57BL/6 mice and added to P. carinii in the presence of nonopsonizing or opsonizing sera (diluted 1:100; A), pretreated with 2 μg/ml 2A11 for 30 min at 37°C with or without opsonizing sera (A), or pretreated with 2 μg/ml 2A11 and anti-CD16/CD32 (Fc) for 30 min at 37°C with and without opsonizing sera (B), and added to P. carinii overnight for a final macrophage to P. carinii cyst ratio of 100:1 (A). Controls included P. carinii cultured without macrophages in the presence of nonopsonizing or opsonizing sera alone or containing the specific antibody. Thereafter, RNA was isolated from the contents of each well and quantitative real time PCR for P. carinii rRNA copy number was performed. Cumulative results from four separate experiments are shown. In A: *, significant differences between nonopsonizing versus opsonizing sera (P = 0.0002); #, significant differences between nonopsonizing sera and 2A11 (P = 0.0001); **, significant differences between 2A11 and opsonizing sera plus 2A11 (P = 0.0005). In B: *, significant differences between nonopsonizing versus opsonizing sera (P = 0.007); #, significant differences between nonopsonizing sera and 2A11 (P = 0.0001); **, significant differences between 2A11 and opsonizing sera plus 2A11 plus Fc Block (Fc; P < 0.0001). Data are expressed as mean percent killing ± SEM.
Figure 8.
Figure 8.
The effects of Dectin-1 blockage in the presence of FcγRII/III-mediated phagocytosis. Alveolar macrophages were isolated from 6–8-wk-old, male C57BL/6 mice and added to P. carinii in the presence of nonopsonizing or opsonizing sera (diluted 1:100; A), pretreated with 2 μg/ml 2A11 for 30 min at 37°C with or without opsonizing sera (A), or pretreated with 2 μg/ml 2A11 and anti-CD16/CD32 (Fc) for 30 min at 37°C with and without opsonizing sera (B), and added to P. carinii overnight for a final macrophage to P. carinii cyst ratio of 100:1 (A). Controls included P. carinii cultured without macrophages in the presence of nonopsonizing or opsonizing sera alone or containing the specific antibody. Thereafter, RNA was isolated from the contents of each well and quantitative real time PCR for P. carinii rRNA copy number was performed. Cumulative results from four separate experiments are shown. In A: *, significant differences between nonopsonizing versus opsonizing sera (P = 0.0002); #, significant differences between nonopsonizing sera and 2A11 (P = 0.0001); **, significant differences between 2A11 and opsonizing sera plus 2A11 (P = 0.0005). In B: *, significant differences between nonopsonizing versus opsonizing sera (P = 0.007); #, significant differences between nonopsonizing sera and 2A11 (P = 0.0001); **, significant differences between 2A11 and opsonizing sera plus 2A11 plus Fc Block (Fc; P < 0.0001). Data are expressed as mean percent killing ± SEM.

Similar articles

Cited by

References

    1. Ives, N.J., B.G. Gazzard, and P.J. Easterbrook. 2001. The changing pattern of AIDS-defining illnesses with the introduction of highly active antiretroviral therapy (HAART) in a London clinic. J. Infect. 42:134–139. - PubMed
    1. Morris, A., R.M. Wachter, J. Luce, J. Turner, and L. Huang. 2003. Improved survival with highly active antiretroviral therapy in HIV-infected patients with severe Pneumocystis carinii pneumonia. AIDS. 17:73–80. - PubMed
    1. Sullivan, J.H., R.D. Moore, J.C. Keruly, and R.E. Chaisson. 2000. Effect of antiretroviral therapy on the incidence of bacterial pneumonia in patients with advanced HIV infection. Am. J. Respir. Crit. Care Med. 162:64–67. - PubMed
    1. Mayaud, C., A. Parrot, and J. Cadranel. 2002. Pyogenic bacterial lower respiratory tract infection in human immunodeficiency virus-infected patients. Eur. Respir. J. Suppl. 36:28s–39s. - PubMed
    1. Vassallo, R., C.F. Thomas, Jr., Z. Vuk-Pavlovic, and A.H. Limper. 1999. Alveolar macrophage interactions with Pneumocystis carinii. J. Lab. Clin. Med. 133:535–540. - PubMed

Publication types