. 2004 Feb;15(2):774-86.
doi: 10.1091/mbc.e03-09-0692. Epub 2003 Dec 2.

Differentiation-induced colocalization of the KH-type splicing regulatory protein with polypyrimidine tract binding protein and the c-src pre-mRNA

Affiliations

Differentiation-induced colocalization of the KH-type splicing regulatory protein with polypyrimidine tract binding protein and the c-src pre-mRNA

Megan P Hall et al. Mol Biol Cell. 2004 Feb.

Abstract

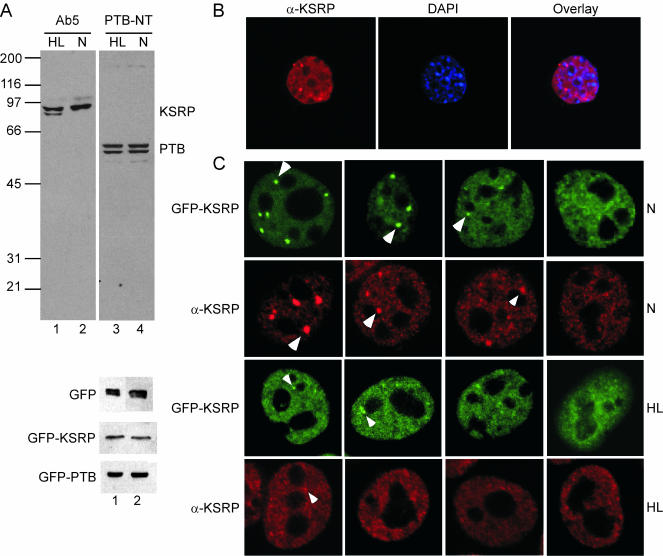
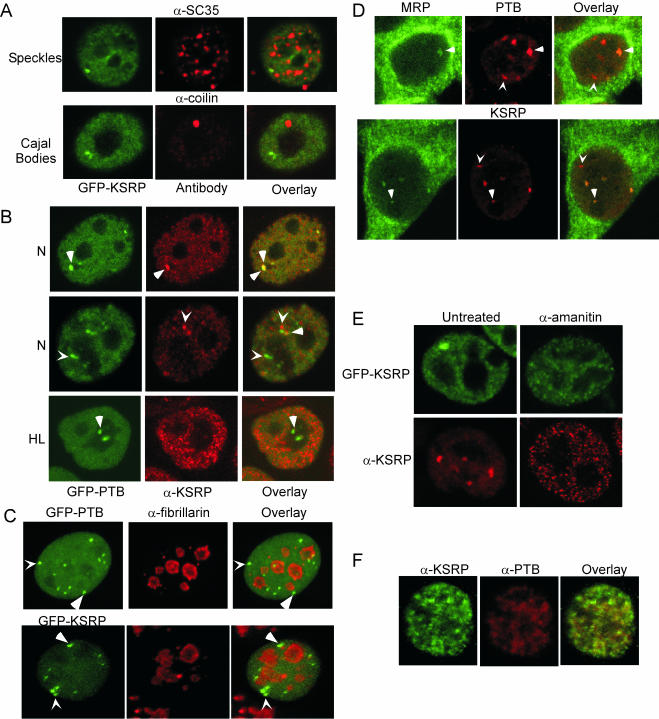
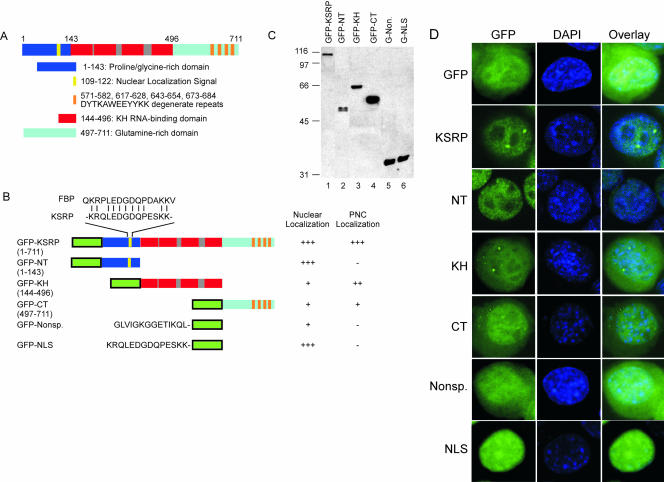
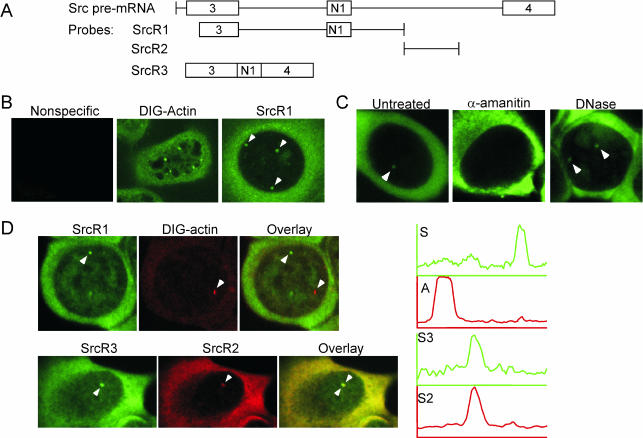
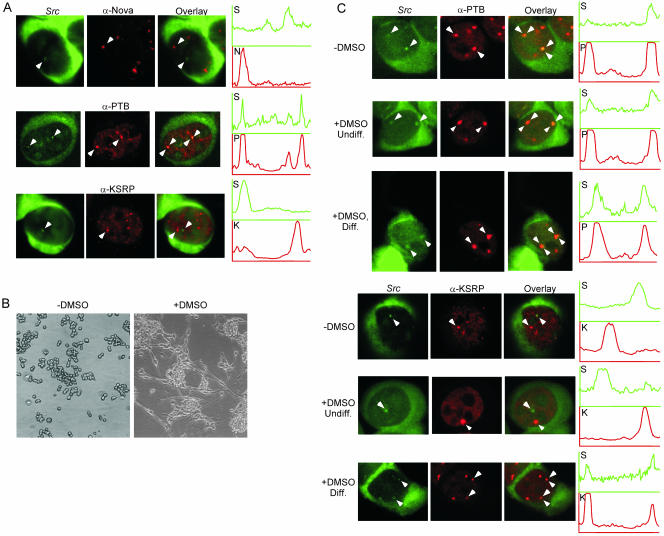
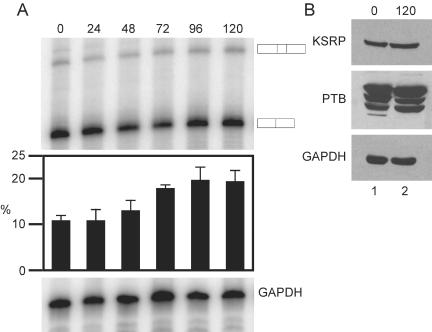
We have examined the subcellular localization of the KH-type splicing regulatory protein (KSRP). KSRP is a multidomain RNA-binding protein implicated in a variety of cellular processes, including splicing in the nucleus and mRNA localization in the cytoplasm. We find that KSRP is primarily nuclear with a localization pattern that most closely resembles that of polypyrimidine tract binding protein (PTB). Colocalization experiments of KSRP with PTB in a mouse neuroblastoma cell line determined that both proteins are present in the perinucleolar compartment (PNC), as well as in other nuclear enrichments. In contrast, HeLa cells do not show prominent KSRP staining in the PNC, even though PTB labeling identified the PNC in these cells. Because both PTB and KSRP interact with the c-src transcript to affect N1 exon splicing, we examined the localization of the c-src pre-mRNA by fluorescence in situ hybridization. The src transcript is present in specific foci within the nucleus that are presumably sites of src transcription but are not generally perinucleolar. In normally cultured neuroblastoma cells, these src RNA foci contain PTB, but little KSRP. However, upon induced neuronal differentiation of these cells, KSRP occurs in the same foci with src RNA. PTB localization remains unaffected. This differentiation-induced localization of KSRP with src RNA correlates with an increase in src exon N1 inclusion. These results indicate that PTB and KSRP do indeed interact with the c-src transcript in vivo, and that these associations change with the differentiated state of the cell.


Figures

Figure 1.
Figure 1.
KSRP localizes to the nucleus in HeLa and N1E-115 cells. (A) Top, Western blot of total cell lysate from HeLa (HL, lanes 1 and 3) or N1E-115 cells (N, lanes 2 and 4) probed with KSRP antibody (Ab5) or PTB antibody (PTB-NT). Bottom three panels, Western blot of HeLa (lane 1) or N1E-115 (lane 2) cell lysates after transient transfection with GFP (top), GFP-KSRP (middle), or GFP-PTB (bottom) expression constructs. Blots were probed with a GFP antibody. (B) KSRP is almost exclusively nuclear. HeLa cells were stained with the Ab5 antibody and with DAPI to visualize the nucleus. The left panel shows Ab5 staining, the middle panel DAPI, and the right panel shows the overlay of the two. (C) The range of staining patterns seen for GFP-KSRP (green) and for immunostained endogenous KSRP (α-KSRP, red). In N1E-115 cells (top two rows), KSRP is seen in more and brighter foci than in HeLa cells (bottom two rows). Arrowheads indicate subnuclear enrichments.
Figure 2.
Figure 2.
KSRP and PTB colocalize to the PNC. (A) Localization of GFP-KSRP compared with various endogenous proteins in N1E-115 cells. The left panels show GFP-KSRP images and the center panels show immunofluorescence images with anti-SC35 or anti-coilin to visualize the respective nuclear structures, and the right panels are overlays. (B) Colocalization of GFP-PTB with immunostained endogenous KSRP in N1E-115 cells (top two rows) and HeLa cells (bottom row). The left column is GFP-PTB, the middle column is KSRP, and the right column is the overlays. Arrowheads denote enrichments with both KSRP and PTB present. Chevrons denote either PTB-(green, left) or KSRP (red, middle)-specific enrichments. (C) PTB and KSRP enrichments are often but not always perinucleolar. Colocalization of GFP-KSRP or GFP-PTB with immunostained endogenous fibrillarin in N1E-115 cells. The left panel is either GFP-PTB or GFP-KSRP, the middle panel is fibrillarin, and the right panel is the overlay. Arrowheads denote enrichments associated with a nucleolus. Chevrons denote enrichments not associated with a nucleolus. (D) Some but not all PTB and KSRP enrichments contain MRP RNA. Colocalization of MRP RNA (green, left) with PTB (red, middle, top row) or KSRP (red, middle, bottom row). Arrowheads denote enrichments with both MRP RNA and either PTB or KSRP. Chevrons denote enrichments of either PTB or KSRP without MRP RNA. (E) PNC localization is dependent on RNA polymerase II transcription. Overexpressed (top row) or endogenous (bottom row) KSRP in N1E-115 cells either untreated (left column) or treated (right column) with 50 μg/ml α-amanitin before fixation. (F) KSRP and PTB show similar dispersion after inhibition of RNA polymerase II. N1E-115 cells were treated with 50 μg/ml α-amanitin before fixation, and then immunostained with both α-KSRP (green, left) and α-PTB (red, middle) antibodies. The right panel is the overlay.
Figure 3.
Figure 3.
KSRP deletion mutants identify regions important for nuclear and PNC localization. (A) The domain structure of KSRP. KSRP contains a proline/glycine-rich N terminus (dark blue) with a nuclear localization signal (NLS, yellow), a central domain with four KH-type RNA-binding domains (red), and an unusual C terminus (light blue) rich in glutamine with four degenerate copies of the repeat DYTKAWEEYYKK (orange). (B) Deletion mutants of KSRP. Mutants were fused to the C terminus of GFP (green), except in the cases of GFP-nonsp. and GFP-NLS, which were fused to the N terminus of GFP. Fusion constructs were rated on their localization to the nucleus and to the PNC. Three + signs indicate the highest amount of localization; a - sign indicates no localization. (C) Western blot analysis verifies expression of GFP-fusion constructs in N1E-115 cells. Lane 1 is GFP-KSRP, lane 2 is GFP-NT, lane 3 is GFP-KH, lane 4 is GFP-CT, lane 5 is GFP-nonspecific, and lane 6 is GFP-NLS. Size markers are noted to the left of the blot. Blot was probed with anti-GFP. For GFP alone see Figure 1A. (D) The KH-domains are sufficient for PNC localization. In the left column are GFP images of cells after transient transfection of each fusion construct. The middle column shows DAPI images, and the right column shows the overlays. GFP alone (top row) was compared with each of the fusion constructs indicated to the left of each row. DAPI staining identifies the nucleus in all panels.
Figure 4.
Figure 4.
src pre-mRNA is enriched in specific, RNA polymerase II-dependent foci within the nucleus. (A) Diagrams of the RNA probes used for FISH to the src transcript. (B) src RNA is enriched in nuclear foci. A nonspecific adenovirus probe (left), a digoxigenin-labeled actin probe (middle), and a src probe (SrcR1, right). Arrowheads indicate foci of src RNA. (C) src RNA enrichments are RNA polymerase II-dependent but unaffected by DNase. Cells were either untreated (left), treated with 50 μg/ml α-amanitin in the cell culture medium (middle), or treated with DNase (right) in the FISH hybridization mixture. All cells were probed with SrcR1. Arrowheads indicate src RNA enrichments. (D) src RNA enrichments are specific. Top row, cells were cohybridized with a digoxigenin-labeled actin probe and fluorescein-labeled SrcR1 (top row). The left panel is src RNA, the middle panel is actin RNA, and the right panel is the overlay. Graphs to the right indicate areas of intensity as measured across a line connecting the foci labeled with arrowheads. Green is src RNA intensity and red is actin RNA intensity. Bottom row, cells were cohybridized with two different src RNA probes, SrcR2 and SrcR3, that cover nonoverlapping regions of the gene. The left panel is fluorescein-labeled SrcR3, the middle panel is DIG-labeled SrcR2, and the right panel is the overlay. Graphs indicate intensity across the foci labeled with arrowheads. Green is SrcR3 and red is SrcR2.
Figure 5.
Figure 5.
Differentiation of N1E-115 cells causes KSRP to relocalize to the src RNA foci. (A) Undifferentiated cells subjected to FISH with SrcR1 before immunolocalization to visualize PTB or KSRP. The left panels show src RNA staining; the middle panels show Nova, PTB, or KSRP immunostaining as labeled; and the right panels are overlays. Arrowheads denote subnuclear enrichments. Graphs indicate fluorescence intensity across the foci labeled with arrowheads. Green is the src RNA signal (S) and red is either the Nova (top row, N), PTB (middle row, P), or KSRP (bottom row, K) immunostain signal. (B) Phase images of N1E-115 cells either undifferentiated (left) or differentiated with 2% DMSO in the culture medium for 5 d (right). (C) Differentiation induces colocalization of KSRP with src. Cells were either untreated (rows 1 and 4, -DMSO) or treated with DMSO for 5 d (rows 2, 3, 5, and 6). Undiff. (rows 2 and 5) indicates cells in the DMSO-treated cultures that maintained their round shape and failed to extend neurites. Diff. (rows 3 and 6) indicates cells in the DMSO-treated cultures that exhibit neurite extension. The left image of each row shows the src RNA image in green. The middle image of each row shows the immunofluorescence for PTB or KSRP. The overlays are shown at the right. Graphs indicate intensity plots across the foci labeled with arrowheads. Green is src RNA intensity (S), red is either PTB (P) or KSRP (K).
Figure 6.
Figure 6.
Differentiation of N1E-115 cells increases N1 inclusion. (A) RT-PCR analysis of cytoplasmic RNA isolated immediately before and every 24 h after the addition of 2% DMSO. The products for N1 exon inclusion and exclusion are noted at the right. The bar graph below illustrates exon inclusion levels with error bars, indicating the SD for n = 3. GAPDH was used as a control for the total RNA level. (B) Protein expression levels remain unaffected by differentiation of N1E-115 cells with DMSO. Western blot analysis of whole-cell extracts either immediately before (lane 1) or 5 d after (lane 2) addition of DMSO to the culture medium. The blot was probed with Ab5 (top row), PTB-NT (middle row), or GAPDH (bottom row) as a loading control.

References

    1. Black, D.L. (1991). Does steric interference between splice sites block the splicing of a short c-src neuron-specific exon in non-neuronal cells? Genes Dev. 5, 389-402. - PubMed
    1. Black, D.L. (1992). Activation of c-src neuron-specific splicing by an unusual RNA element in vivo and in vitro. Cell 69, 795-807. - PubMed
    1. Carmo-Fonseca, M. (2002). The contribution of nuclear compartmentalization to gene regulation. Cell 108, 513-521. - PubMed
    1. Chan, R.C., and Black, D.L. (1995). Conserved intron elements repress splicing of a neuron-specific c-src exon in vitro [published erratum appears in Mol. Cell. Biol. 1997 May;17(5): 2970]. - PMC - PubMed
    2. Mol. Cell. Biol. 15, 6377-6385. - PMC - PubMed
    1. Chen, C., Gherzi, R., Ong, S., Chan, E.L., Raijmakers, R., Pruijn, G.J.M., Stoeklin, G., Moroni, C., Mann, M., and Karin, M. (2001). AU binding proteins recruit the exosome to degrade ARE-containing mRNAs. Cell 107, 451-464. - PubMed

Publication types