. 2004 Feb;15(2):481-96.
doi: 10.1091/mbc.e03-07-0500. Epub 2003 Dec 2.

The EF-hand Ca2+-binding protein p22 plays a role in microtubule and endoplasmic reticulum organization and dynamics with distinct Ca2+-binding requirements

Affiliations

The EF-hand Ca2+-binding protein p22 plays a role in microtubule and endoplasmic reticulum organization and dynamics with distinct Ca2+-binding requirements

Josefa Andrade et al. Mol Biol Cell. 2004 Feb.

Abstract

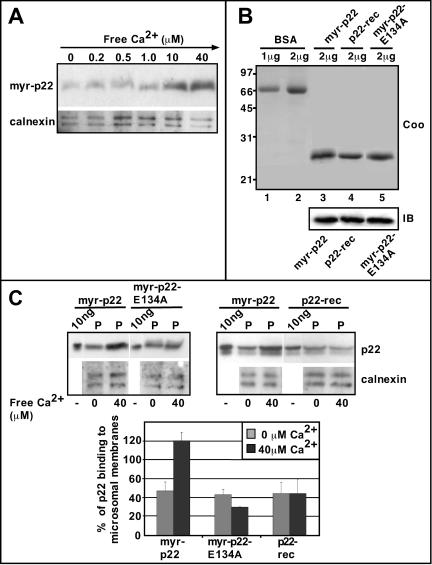
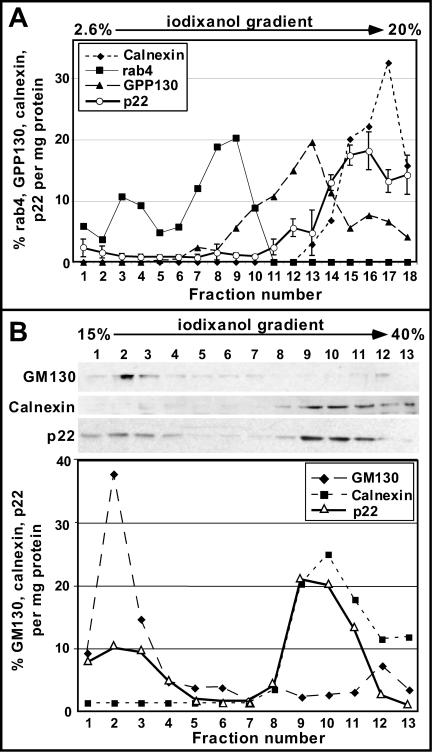
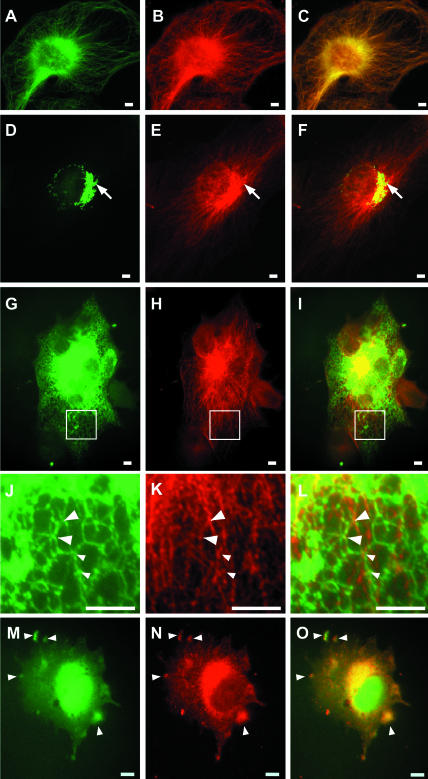
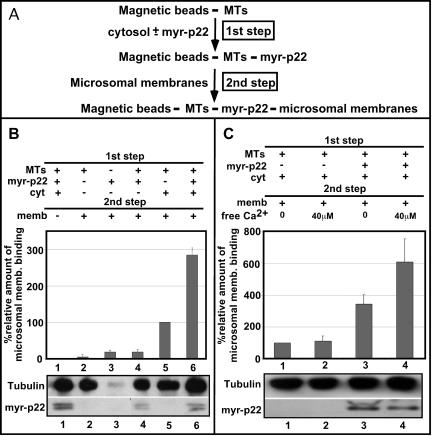
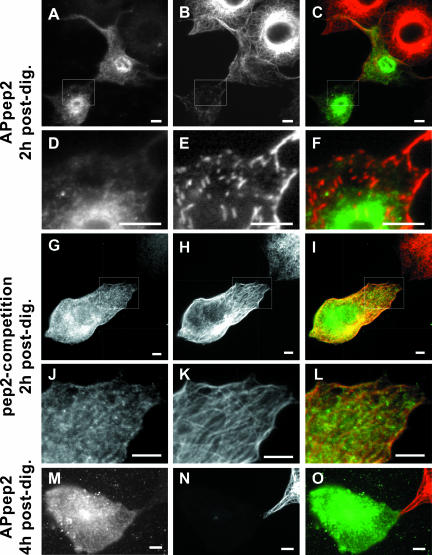
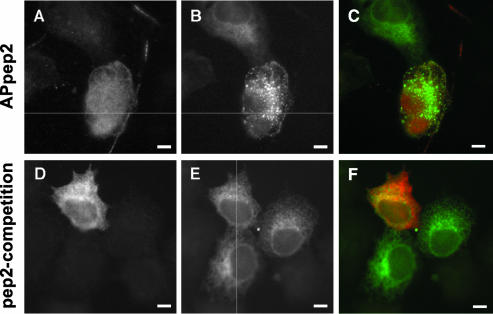
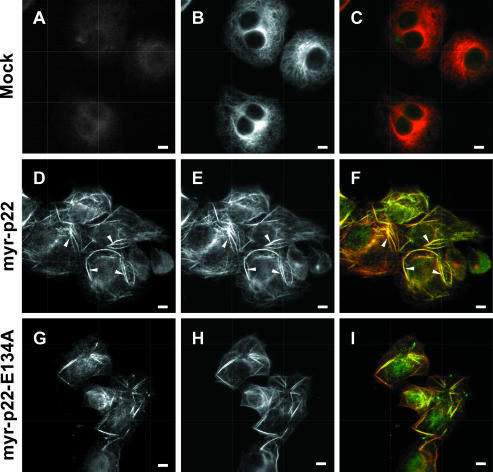
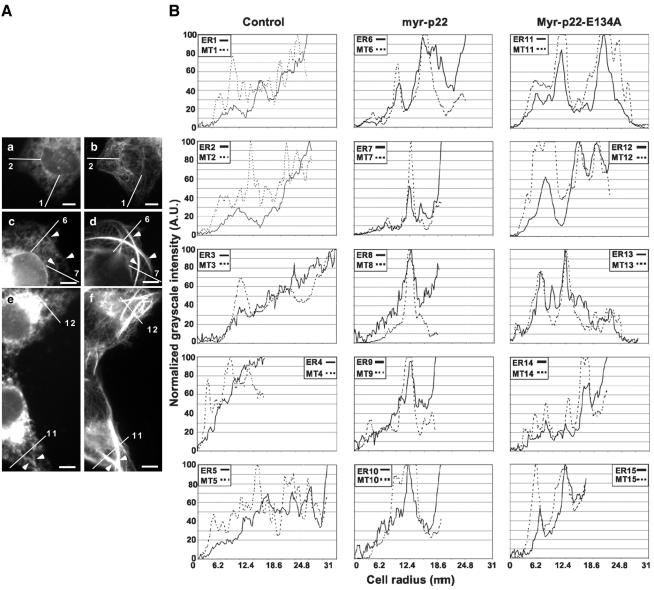
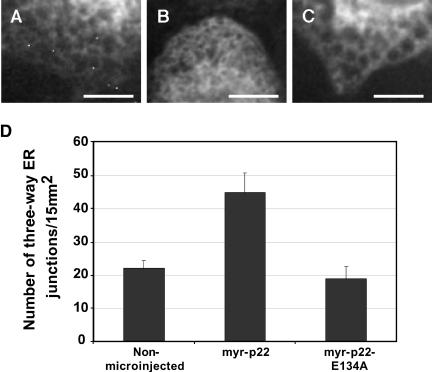
We have reported that p22, an N-myristoylated EF-hand Ca(2+)-binding protein, associates with microtubules and plays a role in membrane trafficking. Here, we show that p22 also associates with membranes of the early secretory pathway membranes, in particular endoplasmic reticulum (ER). On binding of Ca(2+), p22's ability to associate with membranes increases in an N-myristoylation-dependent manner, which is suggestive of a nonclassical Ca(2+)-myristoyl switch mechanism. To address the intracellular functions of p22, a digitonin-based "bulk microinjection" assay was developed to load cells with anti-p22, wild-type, or mutant p22 proteins. Antibodies against a p22 peptide induce microtubule depolymerization and ER fragmentation; this antibody-mediated effect is overcome by preincubation with the respective p22 peptide. In contrast, N-myristoylated p22 induces the formation of microtubule bundles, the accumulation of ER structures along the bundles as well as an increase in ER network formation. An N-myristoylated Ca(2+)-binding p22 mutant, which is unable to undergo Ca(2+)-mediated conformational changes, induces microtubule bundling and accumulation of ER structures along the bundles but does not increase ER network formation. Together, these data strongly suggest that p22 modulates the organization and dynamics of microtubule cytoskeleton in a Ca(2+)-independent manner and affects ER network assembly in a Ca(2+)-dependent manner.


Figures

Figure 4.
Figure 4.
p22 associates with microsomal membranes in a Ca2+-dependent manner. (A) Microsomal membranes were incubated with myr-p22 in the presence of increasing concentrations of free Ca2+, ranging from 0 to 40 μM, and repelleted. Equal amounts of membrane pellets were analyzed by SDS-PAGE and immunoblotting by using p22 (myr-p22) and calnexin (calnexin) antibodies. (B) Bovine serum albumin (BSA) (lanes 1 and 2) and myr-p22 (lane 3), p22-rec (lane 4), and myr-p22-E134A (lane 5) were analyzed by SDS-PAGE and stained with Coomassie Blue (Coo). Equal amounts of myr-p22, p22-rec, and myr-p22-E134A were analyzed by immunoblotting by using antibodies against p22 (IB). (C) Top, microsomal membranes were incubated with myr-p22, myr-p22-E134A, or p22-rec in the presence or absence of 40 μM of free Ca2+. Equal amounts of membrane pellets (P) were compared with the total amount of myr-p22, p22-rec, and myr-p22-E134A (10 ng) added to the assay and analyzed by SDS-PAGE and immunoblotting by using p22 (myr-p22) and calnexin (calnexin) antibodies. (C) Bottom, immunoblots were quantitated as described in MATERIALS AND METHODS. One hundred percent of p22 binding to microsomal membranes would indicate that 100% of the myr-p22 added to the assay was found associated with membranes. Data represents mean ± SD of three experiments.
Figure 1.
Figure 1.
p22 fractionates predominantly with ER membrane fractions using iodixanol gradients. (A) Equal amounts of subcellular fractions were analyzed by SDS-PAGE and immunoblotting by using antibodies against calnexin, rab4, GPP130, and p22. Results were plotted as percentage of rab4, GPP130, calnexin, and p22 per milligram of total protein. p22 data represent mean ± SD of three experiments. (B) Equal protein amounts were analyzed by SDS-PAGE and immunoblotting by using antibodies against GM130, calnexin, and p22. Results were plotted as percentage of GM130, calnexin, and p22 per milligram of total protein.
Figure 2.
Figure 2.
Characterization of the intracellular distribution of p22. BHK (A-F) or BHK-ER (G-O) cells were fixed in 4% paraformaldehyde and processed for immunofluorescence by using antibodies against p22 (B, E, H, K, and N), tubulin (A), and GM130 (D). BHK-ER cells were used for ER staining (G, J, and M). J-L represent magnifications of the regions of interest (square) shown in G-I. In M-O, BHK-ER cells were treated with 5 μg/ml nocodazole for 1 h before cell fixation. Arrows in D-F indicate colocalization between p22 and GM130 structures. Arrowheads in J-O indicate colocalization between p22 and ER structures. Bars, 10 μm.
Figure 3.
Figure 3.
Role of p22 in the interactions between ER membranes and microtubules. (A) Schematic representation of the two-step microtubule-membrane binding assay. (B) Top, DYNABEADS M-280 tosylactivated were covered with taxol-polymerized microtubules (lanes 1 and 2 and 4-6) or not (lane 3) and incubated with or without rat liver cytosol (lanes 1, 5, and 6) and/or myr-p22 (lanes 1, 3, 4, 6) in the first step. Then, beads were incubated with (lanes 2-6) or without (lane 1) microsomal membranes in the second step and immunoblotted with calnexin antibodies. A value of 100% was assigned to the relative binding of microsomal membranes to microtubule-covered beads after incubation with cytosol in the absence of myr-p22 (lane 5). Data represents mean ± SD of three experiments. (B) Bottom, equal amounts of reaction mixtures were analyzed by SDS-PAGE and immunoblotting by using antibodies against tubulin (tubulin) and p22 (myr-p22). (C) Top, microtubule-membrane binding bead assays were performed in the presence of cytosol with (lanes 3 and 4) or without (lanes 1 and 2) myr-p22 in the first step and in the presence (lanes 2 and 4) or absence (lanes 1 and 3) of 40 μM free Ca2+ during the second step. A value of 100% was assigned to the relative amount of microsomal membrane binding shown in lane 1, as described above. Data represents mean ± SD of three experiments. (C) Bottom, equal amounts of reaction mixtures were analyzed by SDS-PAGE and immunoblotting by using antibodies against tubulin (tubulin) and p22 (myr-p22).
Figure 5.
Figure 5.
Effect of bulk microinjection of anti-p22 APpep2 antibodies on the organization of the microtubule cytoskeleton. BHK cells were bulk microinjected with APpep2 antibodies (APpep2: A-F and M-O) or APpep2 previously preincubated with pep2 peptide (pep2-competition: G-L) and then allowed to recover at 37°C for 2 h (A-L, 2 h postdig) or 4 h (M-O, 4 h postdig) before fixation. Cells were processed for immunofluorescence by using tubulin antibodies (B, E, H, K, and N). A, D, G, J, and M show APpep2 staining, indicating bulk-microinjected cells. C, F, I, L, and O represent merged images. D-F and J-L are magnifications of the regions of interest shown in A-C and G-I, respectively. Bars, 10 μm.
Figure 7.
Figure 7.
Effect of bulk microinjection of APpep2 antibodies on the organization of the ER network. BHK-ER cells were bulk microinjected with APpep2 (A-C, APpep2) or APpep2 previously preincubated with pep2 (D-F, pep2-competition) and allowed to recover for 2 h at 37°C. Then cells were fixed and processed for immunofluorescence. A and D show APpep2 staining, indicating bulk-microinjected cells. The fluorescence pattern of ECFP-ER protein shows the ER network (B and E). C and F represent the merged images. Bars, 10 μm.
Figure 6.
Figure 6.
Effect of bulk microinjection of myr-p22 or myr-p22-E134A on the organization of the microtubule cytoskeleton. BHK cells were mock (A-C), myr-p22 (D-F and J-L) or myr-p22-E134A (G-I) bulk microinjected. After 2 h at 37°C, cells were fixed and processed for immunofluorescence by using APpep2 (A, D, and G) and tubulin (B, E, and H) antibodies. C, F, and I represent merged images. Bars, 10 μm. Arrowheads in D-F indicate p22-positive microtubule bundles.
Figure 8.
Figure 8.
ER structures accumulate at myr-p22-induced microtubule bundles. (A) BHK-ER cells were mock (a and b), myr-p22 (c and d), or myr-p22-E134A (e and f) bulk microinjected, allowed to recover for 2 h and then processed for immunofluorescence by using tubulin antibodies. a, c, and e show the ECFP-ER fluorescence pattern, and b, d, and f show the microtubule staining. Lines were drawn from the periphery to the perinuclear region in mock (lines 1 and 2) and myr-p22 (lines 6 and 7) or myr-p22-E134A (lines 11 and 12) bulk-microinjected cells, and the corresponding plot profiles are shown in B. These lines were made to cross several myr-p22 (lines 6 and 7) or myr-p22-E134A (lines 11 and 12) induced microtubule bundles. Bars, 10 μm. (B) ImageJ software was used to produce plot profiles of the microtubule (MT: dashed lines) and ER (solid lines) networks along the lines drawn in the cells shown in A and in other not-shown cells. ER1/MT1-ER5/MT5: profiles for mock bulk-microinjected cells. ER6/MT6-ER10/MT10: profiles for myr-p22 bulk-microinjected cells. ER11/MT11-ER15/MT15: profiles for myr-E134A-p22 bulk-microinjected cells.
Figure 9.
Figure 9.
Effect of bulk microinjection of myr-p22 or myr-p22-E134A on ER network formation. BHK-ER cells were mock (A), myr-p22 (B), or myr-E134A-p22 (C) bulk microinjected, allowed to recover for 2 h, processed for immunofluorescence, and analyzed by confocal microscopy. A-C are representative images showing ECFP-ER fluorescence pattern in areas free of microtubule bundles. Bars, 10 μm. (D) Using ImageJ software, the number of three-way ER junctions was counted by confocal microscopy in several 15-μm2 regions of interest (n = 11-25) as a parameter of ER network formation in vivo. Data represents mean ± SD (n = 11-25).

Similar articles

Cited by

References

    1. Allan, V.J., and Schroer, T.A. (1999). Membrane motors. Curr. Opin. Cell Biol. 11, 476-482. - PubMed
    1. Alvarez, C., Fujita, H., Hubbard, A., and Sztul, E. (1999). ER to Golgi transport: requirement for p115 at a pre-Golgi VTC stage. J. Cell Biol. 147, 1205-1222. - PMC - PubMed
    1. Ames, J.B., Ishima, R., Tanaka, T., Gordon, J.I., Stryer, L., and Ikura, M. (1997). Molecular mechanics of calcium-myristoyl switches. Nature 389, 198-202. - PubMed
    1. Apodaca, G. (2001). Endocytic traffic in polarized epithelial cells: role of the actin and microtubule cytoskeleton. Traffic 2, 149-159. - PubMed
    1. Ashby, M.C., and Tepikin, A.V. (2002). Polarized calcium and calmodulin signaling in secretory epithelia. Physiol. Rev. 82, 701-34. - PubMed

Publication types