

Mitotic partitioning and selective reorganization of tissue-specific transcription factors in progeny cells
- PMID: 14657346
- PMCID: PMC299826
- DOI: 10.1073/pnas.2533076100
Mitotic partitioning and selective reorganization of tissue-specific transcription factors in progeny cells
Abstract
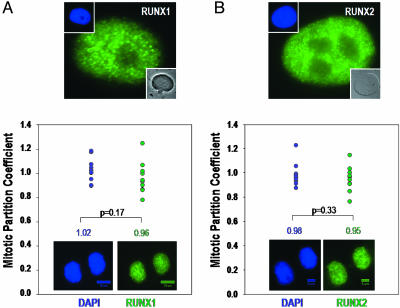
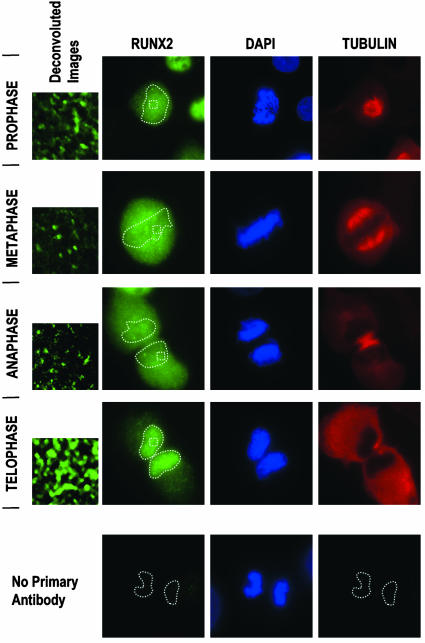
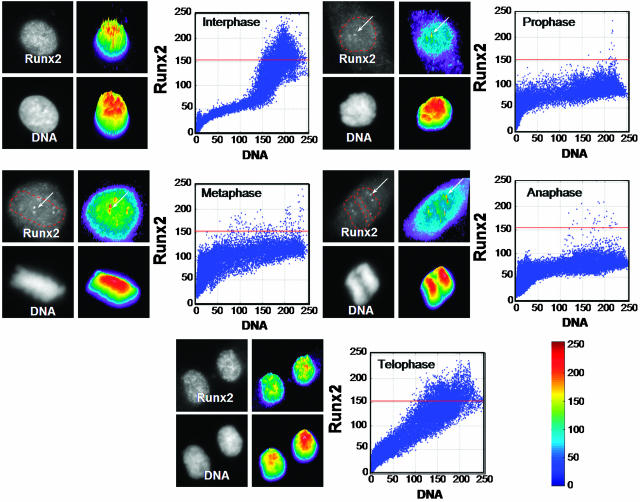
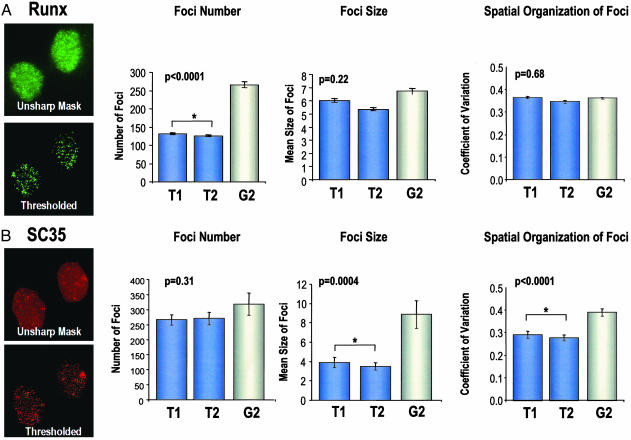
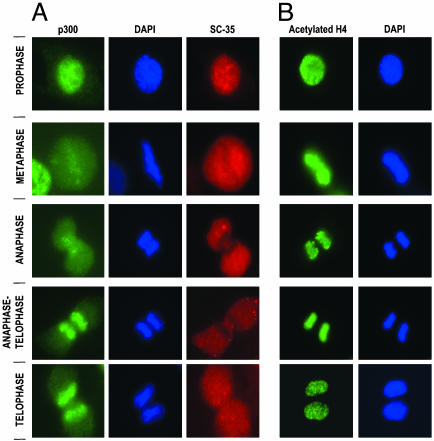
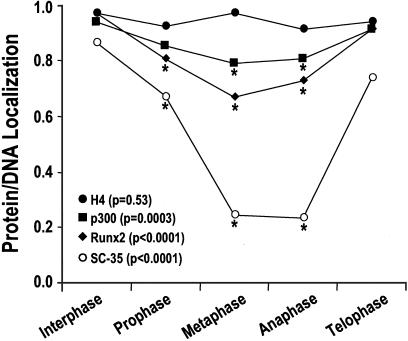
Postmitotic gene expression requires restoration of nuclear organization and assembly of regulatory complexes. The hematopoietic and osteogenic Runx (Cbfa/AML) transcription factors are punctately organized in the interphase nucleus and provide a model for understanding the subnuclear organization of tissue-specific regulatory proteins after mitosis. Here we have used quantitative in situ immunofluorescence microscopy and quantitative image analysis to show that Runx factors undergo progressive changes in cellular localization during mitosis while retaining a punctate distribution. In comparison, the acetyl transferase p300 and acetylated histone H4 remain localized with DNA throughout mitosis while the RNA processing factor SC35 is excluded from mitotic chromatin. Subnuclear organization of Runx foci is completely restored in telophase, and Runx proteins are equally partitioned into progeny nuclei. In contrast, subnuclear organization of SC35 is restored subsequent to telophase. Our results show a sequential reorganization of Runx and its coregulatory proteins that precedes restoration of RNA processing speckles. Thus, mitotic partitioning and spatiotemporal reorganization of regulatory proteins together render progeny cells equivalently competent to support phenotypic gene expression.
Figures
Similar articles
-
Quantitative signature for architectural organization of regulatory factors using intranuclear informatics.J Cell Sci. 2004 Oct 1;117(Pt 21):4889-96. doi: 10.1242/jcs.01229. Epub 2004 Sep 14. J Cell Sci. 2004. PMID: 15367579
-
Differential dynamics of splicing factor SC35 during the cell cycle.J Biosci. 2008 Sep;33(3):345-54. doi: 10.1007/s12038-008-0054-3. J Biosci. 2008. PMID: 19005234
-
Brd4 marks select genes on mitotic chromatin and directs postmitotic transcription.Mol Biol Cell. 2009 Dec;20(23):4899-909. doi: 10.1091/mbc.e09-05-0380. Epub 2009 Oct 7. Mol Biol Cell. 2009. PMID: 19812244 Free PMC article.
-
The dynamic organization of gene-regulatory machinery in nuclear microenvironments.EMBO Rep. 2005 Feb;6(2):128-33. doi: 10.1038/sj.embor.7400337. EMBO Rep. 2005. PMID: 15689940 Free PMC article. Review.
-
Temporal and spatial parameters of skeletal gene expression: targeting RUNX factors and their coregulatory proteins to subnuclear domains.Connect Tissue Res. 2003;44 Suppl 1:149-53. Connect Tissue Res. 2003. PMID: 12952189 Review.
Cited by
-
Subnuclear targeting of the Runx3 tumor suppressor and its epigenetic association with mitotic chromosomes.J Cell Physiol. 2009 Mar;218(3):473-9. doi: 10.1002/jcp.21630. J Cell Physiol. 2009. PMID: 19006109 Free PMC article.
-
Mitotic Inheritance of mRNA Facilitates Translational Activation of the Osteogenic-Lineage Commitment Factor Runx2 in Progeny of Osteoblastic Cells.J Cell Physiol. 2016 May;231(5):1001-14. doi: 10.1002/jcp.25188. Epub 2015 Sep 18. J Cell Physiol. 2016. PMID: 26381402 Free PMC article.
-
Mitotic bookmarking of genes: a novel dimension to epigenetic control.Nat Rev Genet. 2010 Aug;11(8):583-9. doi: 10.1038/nrg2827. Epub 2010 Jul 13. Nat Rev Genet. 2010. PMID: 20628351 Free PMC article. Review.
-
Cell cycle related modulations in Runx2 protein levels are independent of lymphocyte enhancer-binding factor 1 (Lef1) in proliferating osteoblasts.J Mol Histol. 2007 Oct;38(5):501-6. doi: 10.1007/s10735-007-9143-0. Epub 2007 Sep 21. J Mol Histol. 2007. PMID: 17885813
-
Cell cycle-dependent binding of HMGN proteins to chromatin.Mol Biol Cell. 2008 May;19(5):1816-24. doi: 10.1091/mbc.e07-10-1018. Epub 2008 Feb 20. Mol Biol Cell. 2008. PMID: 18287527 Free PMC article.
References
-
- Merriman, H. L., van Wijnen, A. J., Hiebert, S., Bidwell, J. P., Fey, E., Lian, J., Stein, J. & Stein, G. S. (1995) Biochemistry 34, 13125–13132. - PubMed
-
- van Steensel, B., Jenster, G., Damm, K., Brinkmann, A. O. & van Driel, R. (1995) J. Cell. Biochem. 57, 465–478. - PubMed
-
- McNeil, S., Guo, B., Stein, J. L., Lian, J. B., Bushmeyer, S., Seto, E., Atchison, M. L., Penman, S., van Wijnen, A. J. & Stein, G. S. (1998) J. Cell. Biochem. 68, 500–510. - PubMed
Publication types
MeSH terms
Substances
Grants and funding
LinkOut - more resources
Full Text Sources
Other Literature Sources
Molecular Biology Databases
Miscellaneous
