

doi: 10.1073/pnas.2036429100.
Epub 2003 Dec 1.
Random Boolean network models and the yeast transcriptional network
Affiliations
- PMID: 14657375
- PMCID: PMC299805
- DOI: 10.1073/pnas.2036429100
Item in Clipboard
Random Boolean network models and the yeast transcriptional network
Proc Natl Acad Sci U S A.
.
Abstract
The recently measured yeast transcriptional network is analyzed in terms of simplified Boolean network models, with the aim of determining feasible rule structures, given the requirement of stable solutions of the generated Boolean networks. We find that, for ensembles of generated models, those with canalyzing Boolean rules are remarkably stable, whereas those with random Boolean rules are only marginally stable. Furthermore, substantial parts of the generated networks are frozen, in the sense that they reach the same state, regardless of initial state. Thus, our ensemble approach suggests that the yeast network shows highly ordered dynamics.
Figures
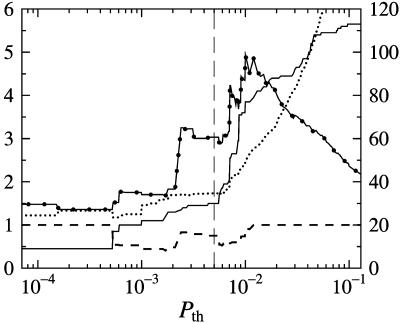
Topological properties of the yeast regulatory network described by Lee et al. (1) for different P value thresholds excluding nodes with no outputs: number of nodes (solid line), mean connectivity (dotted line), mean pairwise distance (radius) (dotted–solid line), and fraction of node pairs that are connected (dashed line). The right y axis corresponds to the number of nodes, whereas the other quantities are indicated on the left y axis. Self-couplings were excluded, but the figure looks similar when they are included. The dashed vertical line marks the threshold, Pth = 0.005.
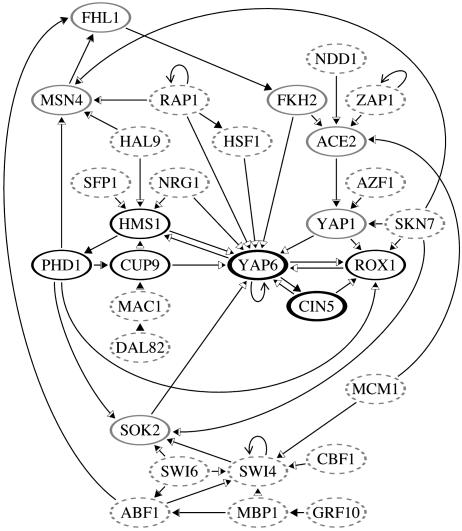
The Pth = 0.005 network excluding nodes with no outputs to other nodes. The filled areas in the arrowheads are proportional to the probability of each coupling to be in a forcing structure when the nested canalyzing rules are used on the network without self-interactions. This probability ranges from approximately one-fourth, for the inputs to YAP6, to one, for the inputs to one-input nodes. Nodes that will reach a frozen state (on or off) in the absence of down-regulating self-interactions, regardless of the choice of rules, are shown as dashes. For the other nodes, the grayscale indicates the probability of being frozen in the absence of self-interactions, ranging from ≈97% (bold black) to >99.9% (light gray).
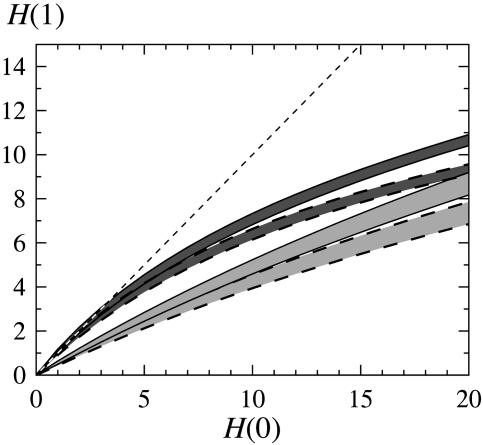
Evolution of different Hamming distances, H(0) with one time step to H(1) [Derrida plots (4)] for random rules (dark gray) and nested canalyzing rules (light gray) with and without self-couplings (dashed borders), respectively. (Down-regulating self-couplings are allowed.) The bands correspond to 1σ variation among the different rule assignments generated on the architecture in Fig. 2. Statistics were gathered from 1,000 starts on each of 1,000 rule assignments.
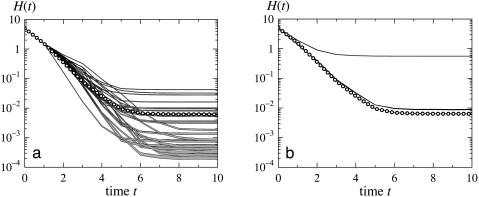
The average time evolution of perturbed fixed points for nested canalyzing rules, starting from Hamming distance, H(0) = 5; impact of the network architecture (a) and impact of the self-interactions (b). The lines marked with circles in both figures correspond to the network in Fig. 2 without self-interactions. The gray lines in a show the relaxation for 26 different rewired architectures with no self-interactions, with 1σ errors of the calculated means indicated by the line widths. The black lines in b correspond to the network in Fig. 2 with self-interactions. The upper line shows the case when it is allowed to toggle nodes with self-interactions as a state at H(0) = 5 is picked, whereas the lower line shows the relaxation if this toggling is not allowed. The widths of these lines show the difference between allowing self-interactions to be repressive or not repressive.
Similar articles
-
Boolean networks with biologically relevant rules show ordered behavior.Biosystems. 2007 Jul-Aug;90(1):40-7. doi: 10.1016/j.biosystems.2006.06.007. Epub 2006 Jun 29. Biosystems. 2007. PMID: 17188807
-
Anomalies in the transcriptional regulatory network of the yeast Saccharomyces cerevisiae.J Theor Biol. 2010 Apr 7;263(3):328-36. doi: 10.1016/j.jtbi.2009.12.008. Epub 2009 Dec 22. J Theor Biol. 2010. PMID: 20004671
-
Genetic networks with canalyzing Boolean rules are always stable.Proc Natl Acad Sci U S A. 2004 Dec 7;101(49):17102-7. doi: 10.1073/pnas.0407783101. Epub 2004 Nov 30. Proc Natl Acad Sci U S A. 2004. PMID: 15572453 Free PMC article.
-
Stability of Boolean networks with generalized canalizing rules.Phys Rev E Stat Nonlin Soft Matter Phys. 2012 Apr;85(4 Pt 2):046106. doi: 10.1103/PhysRevE.85.046106. Epub 2012 Apr 11. Phys Rev E Stat Nonlin Soft Matter Phys. 2012. PMID: 22680537
-
Boolean network models of cellular regulation: prospects and limitations.J R Soc Interface. 2008 Aug 6;5 Suppl 1(Suppl 1):S85-94. doi: 10.1098/rsif.2008.0132.focus. J R Soc Interface. 2008. PMID: 18508746 Free PMC article. Review.
Cited by
-
Properties of Boolean dynamics by node classification using feedback loops in a network.BMC Syst Biol. 2016 Aug 24;10(1):83. doi: 10.1186/s12918-016-0322-z. BMC Syst Biol. 2016. PMID: 27558408 Free PMC article.
-
Computing preimages of Boolean networks.BMC Bioinformatics. 2013;14 Suppl 10(Suppl 10):S4. doi: 10.1186/1471-2105-14-S10-S4. Epub 2013 Aug 12. BMC Bioinformatics. 2013. PMID: 24267277 Free PMC article. Clinical Trial.
-
Investigation on changes of modularity and robustness by edge-removal mutations in signaling networks.BMC Syst Biol. 2017 Dec 21;11(Suppl 7):125. doi: 10.1186/s12918-017-0505-2. BMC Syst Biol. 2017. PMID: 29322936 Free PMC article.
-
Evolution of control with learning classifier systems.Appl Netw Sci. 2018;3(1):30. doi: 10.1007/s41109-018-0088-x. Epub 2018 Aug 13. Appl Netw Sci. 2018. PMID: 30839802 Free PMC article.
-
A novel knowledge-driven systems biology approach for phenotype prediction upon genetic intervention.IEEE/ACM Trans Comput Biol Bioinform. 2011 Sep-Oct;8(5):1170-82. doi: 10.1109/TCBB.2011.18. IEEE/ACM Trans Comput Biol Bioinform. 2011. PMID: 21282866 Free PMC article.
References
-
- Lee, T. I., Rinaldi, N. J., Robert, F., Odom, D. T., Bar-Joseph, Z., Gerber, G. K., Hannett, N. M., Harbison, C. T., Thompson, C. M., Simon, I., et al. (2002) Science 298, 799–804. - PubMed
-
- Hughes, T. R., Marton, M. J., Jones, A. R., Roberts, C. J., Stoughton, R., Armour, C. D., Bennett, H. A., Coffey, E., Dai, H., He, Y. D., et al. (2000) Cell 102, 109–126. - PubMed
-
- Kauffman, S. A. (1993) Origins of Order: Self-Organization and Selection in Evolution (Oxford Univ. Press, Oxford).
-
- Derrida, B. & Weisbuch, G. (1986) J. Physique 47, 1297–1303.
-
- Harris, S. E., Sawhill, B. K., Wuensche, A. & Kauffman, S. (2002) Complexity 7, 23–40.
Publication types
MeSH terms
LinkOut - more resources
Full Text Sources
Other Literature Sources
Molecular Biology Databases
