. 2004 Jan;134(1):118-28.
doi: 10.1104/pp.103.025379. Epub 2003 Dec 4.

Induction of salt and osmotic stress tolerance by overexpression of an intracellular vesicle trafficking protein AtRab7 (AtRabG3e)

Affiliations

Induction of salt and osmotic stress tolerance by overexpression of an intracellular vesicle trafficking protein AtRab7 (AtRabG3e)

Alexander Mazel et al. Plant Physiol. 2004 Jan.

Abstract

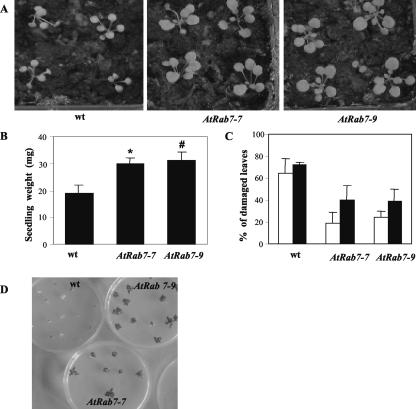
Adaptation to stress requires removal of existing molecules from various cellular compartments and replacing them with new ones. The transport of materials to and from the specific compartments involved in the recycling and deposition of macromolecules is carried out by an intracellular vesicle trafficking system. Here, we report the isolation of a vesicle trafficking-regulating gene, AtRabG3e (formerly AtRab7), from Arabidopsis. The gene was induced during programmed cell death after treatment of intact leaves with superoxide and salicylic acid or infection with necrogenic pathogens. Transgenic plants that expressed the AtRabG3e gene under the constitutive 35S promoter from cauliflower mosaic virus exhibited accelerated endocytosis in roots, leaves, and protoplasts. The transgenic plants accumulated sodium in the vacuoles and had higher amounts of sodium in the shoots. The transgenic plants also showed increased tolerance to salt and osmotic stresses and reduced accumulation of reactive oxygen species during salt stress. These results imply that vesicle trafficking plays an important role in plant adaptation to stress, beyond the housekeeping function in intracellular vesicle trafficking.


Figures

Figure 1.
Figure 1.
Expression of AtRab7 (AtRabG3e) gene during stress. Leaf RNA was isolated 5 h after treatment with a superoxide generating mixture of 1 mm X and 0.75 units mL-1 XO with or without 0.75 mm SA. The substances were infiltrated into interstitial space of intact Arabidopsis leaves. RNA was prepared and used as template for radioactive reverse transcription (RT)-PCR as described in “Materials and Methods.” Randomly labeled 18S rRNA from pea (Pisum sativum) was used for RNA loading control.
Figure 2.
Figure 2.
AtRabG3e gene analysis. The AtRabG3e gene was amplified by RT-PCR from RNA prepared from X/XO + SA-treated leaves using the primers from both ends of the gene. The gene was fully sequenced and subjected BLAST analysis against the GenBank database (Altschul et al., 1997). Alignment was done with ClustaIW and Boxshadow programs. At, Arabidopsis; Lj, Lotus japonicus; Hs, human (Homo sapiens). Numbers indicate position of amino acids from the N terminus. The effector region of the Rab7 subfamily is indicated by asterisks. The mismatch between the isolated gene sequence and the GenBank record is at position 100 (resulting in exchange of N to S). The regions involved in GTP binding and hydrolysis are lined on top. The AtRabG3e fragment isolated by differential display corresponds to the last 234 bp.
Figure 3.
Figure 3.
Northern analysis of AtRabG3e gene expression. A, AtRabG3e gene expression in Arabidopsis cell cultures was tested 2 d after cell transfer. Cultures were treated with 5 mm Glc (G) and either a low (2 units mL-1) or high (8 units mL-1) dose of Glc oxidase (GO) for 3 h. B, AtRabG3e expression in Arabidopsis leaves that were inoculated for 3 h with 108 colony forming units of avirulent (hypersensitive reaction-inducing) strain of Pseudomonas syringae carrying the avrRpm1 avirulence gene (Avr), nonvirulent hrp- mutant strain, or buffer control (10 mm MgCl2). Botrytis cinerea treatment was done by inoculation of leaves with 5 μL of 105 mL-1 pregerminated spores for 24 h. Mock treatment with inoculation buffer served as control. C, Tissue-specific expression of AtRabG3e. Total RNA was prepared from 1-week-old seedlings or from 6-week-old roots (old root), or leaves (old leaf), flowers, or seeds. RNA from other tissues (roots and leaves) was from 4-week-old plants.
Figure 4.
Figure 4.
AtRab7 expression in wild-type and transgenic Arabidopsis. Northern-blot analysis of AtRab7 gene expression in wild-type (wt) and AtRab7 transformed Arabidopsis plants (lines AtRab7-7 and AtRab7-9). Total RNA was extracted, and 5 μg was used to probe with AtRab7 or with 18S rRNA (as loading control).
Figure 5.
Figure 5.
Uptake of the membrane probe FM1-43 in transgenic Arabidopsis. A to F, Wild-type (A-C) and AtRab7-7 transgenic (D-F) seedlings were grown in Gelrite for 12 d. Plants were placed on microscope slides without cover glass and overlaid with solution of FM1-43. Pictures were taken in an epi-fluorescent microscope at the indicated times. H to M, Leaves of 24-d-old wild-type (H-J) and transgenic plants (K-M) growing in soil were cut through a potato tuber to obtain thin cross sections that were incubated in FM1-43 and photographed at the indicated times. Inset, Magnified view that shows the spreading of the dye within cells. N, Protoplasts were prepared from leaves of 5-week-old wild-type (wt) and AtRab7-7 transgenic plants. Protoplasts were placed in an etched microscope slide, and the FM1-43 dye was added. Numbers indicate time after dye addition in minutes.
Figure 6.
Figure 6.
Salt stress tolerance in wild-type and AtRabG3e transgenic Arabidopsis. A, Salt tolerance in young plants. Both wild-type and transgenic plants were germinated on agar plates and transferred after 7 d to soil. After another 7 d, plants were irrigated every 3 d with 200 mm NaCl from below (by placing the pots into salt solution) and from above (by adding 20 mL of solution per pot). The photograph was taken 1 week after beginning of treatment. The representative experiment from two performed is shown (n = 8). B, Fresh weight of the plants shown in A. The values are means ± se of the representative experiment, n = 8. *, P = 0.013; #, P = 0.009 compared with wild type. Two experiments were performed with similar results. C, Leaf damage during salt stress in plants grown in soil for 25 d and then treated with salt as described in A. The percentage of damaged leaves was scored on d 5 (white bars) and 7 (black bars) after the treatment. Leaves were classified as damaged if more than 50% of a leaf's surface was bleached, or if they appeared severely wilted. Shown is one of three experiments with similar results. No damage was seen in plants irrigated with water. D, Salt tolerance in plants grown on agar. Seedlings were germinated on agar plates containing one-half-strength Murashige and Skoog salts and transferred after 7 d to plates supplemented with 150 mm NaCl. The photograph was taken 4 weeks after transfer to high salt.
Figure 7.
Figure 7.
Sodium localization in roots and in shoots. A and B, Wild-type (A) and transgenic (B) plants were germinated on agar plates. After 8 d, both plants were transferred to Whatman 3M paper soaked with 100 mm NaCl. SodiumGreen dye was added to the medium 2 d later, and plants were examined under fluorescent microscope after 36 h. C, Wild-type and transgenic plants were germinated on agar plates in one-half-strength Murashige and Skoog medium. After 7 d, the plants were transferred to plates containing 150 mm NaCl. One day later the plates were air dried (by opening the cover of the petri dish for 6 h in a laminar flow hood) and filled with 8 mL of water containing 0.81 μCi 22NaCl (Amersham, Buckinghamshire, UK). The aerial parts of the seedlings were harvested after 3 d and measured in a γ-counter (5 min sample-1). Samples (n = 5) were analyzed according to unpaired Student's t test. *, P value < 0.03 (compared with wild type). Representative experiment from three similar tests is shown.
Figure 8.
Figure 8.
ROS production in salt-stressed Arabidopsis seedlings. A and B, Wild-type and transgenic plants were germinated on agar plates containing one-half-strength Murashige and Skoog medium. After 7 d, seedlings were transferred to one-half-strength Murashige and Skoog liquid medium with (B) or without (A) 200 mm NaCl for 16 h. ROS production was detected in an epi-fluorescent microscope (IX70, Olympus, Tokyo) by addition of 10 μm 2′,7′-dichlorofluorescin. Pictures were taken 5 min after addition of the dye. The corresponding bright-field photographs are at the sides. C, Involvement of NADPH oxidase in ROS production of salt-treated seedlings was tested by addition of an NADPH oxidase inhibitor, diphenylene iodonium (DPI), in two steps: 20 μm at the onset of the salt treatment and 30 min before the photography. A representative experiment from three with similar results is shown. Similar results were also obtained with AtRab7-9 transgenic plants (data not shown).
Figure 9.
Figure 9.
Tolerance of wild-type and AtRabG3e transgenic plants to osmotic stress. A, Wild type (wt) and transgenic plants were germinated on agar plates, and after 4 d, the seedlings were transferred to plates containing 500 mm sorbitol. After 7 d of growth in sorbitol, the aerial parts of the plants were cut off and their fresh weight measured. Because the transgenic plants develop slightly slower, the data are presented as a percentage of shoot weight of untreated plants (in each line separately). The values are means ± se (n = 5) of a representative experiment from three performed. *, P = 0.003; #, P = 0.03 compared with wild type. B, Recovery of wild-type and transgenic plants after sorbitol stress. After growth of plants for 1 week on the sorbitol-containing agar, plants were transferred back to one-half-strength Murashige and Skoog salts and grown for an additional 7 d. The values are mean fresh weight of shoots ± se of two experiments (n = 5). *, P = 0.0009; #, P < 0.0001 compared with wild type. C, Photograph of plants from the representative experiment described in B, 7 d after transfer of plants back to one-half-strength Murashige and Skoog medium.

Similar articles

Cited by

References

    1. Altschul SF, Madden TL, Schaffer AA, Zhang JH, Zhang Z, Miller W, Lipman DJ (1997) Gapped BLAST and PSI-BLAST: a new generation of protein database search programs. Nucleic Acids Res 25: 3389-3402 - PMC - PubMed
    1. Apse MP, Aharon GS, Snedden WA, Blumwald E (1999) Salt tolerance conferred by overexpression of a vacuolar Na+/H+ antiport in Arabidopsis. Science 258: 1256-1258 - PubMed
    1. Bartels D, Nelson D (1994) Approaches to improve stress tolerance using molecular studies. Plant Cell Environ 17: 659-667
    1. Blumwald E (2000) Sodium transport and salt tolerance in plants. Curr Opin Cell Biol 12: 431-434 - PubMed
    1. Bolte S, Schiene K, Dietz KJ (2000) Characterization of a small GTP-binding protein of the rab 5 family in Mesembryanthemum crystallinum with increased level of expression during early salt stress. Plant Mol Biol 42: 923-936 - PubMed

MeSH terms