

doi: 10.1186/gb-2003-4-12-r83.
Epub 2003 Nov 24.
Multiclass classification of microarray data with repeated measurements: application to cancer
Affiliations
- PMID: 14659020
- PMCID: PMC329422
- DOI: 10.1186/gb-2003-4-12-r83
Item in Clipboard
Multiclass classification of microarray data with repeated measurements: application to cancer
Genome Biol.
2003.
Erratum in
- Genome Biol. 2005;6(13):405-405.4
Abstract
Prediction of the diagnostic category of a tissue sample from its gene-expression profile and selection of relevant genes for class prediction have important applications in cancer research. We have developed the uncorrelated shrunken centroid (USC) and error-weighted, uncorrelated shrunken centroid (EWUSC) algorithms that are applicable to microarray data with any number of classes. We show that removing highly correlated genes typically improves classification results using a small set of genes.
Figures
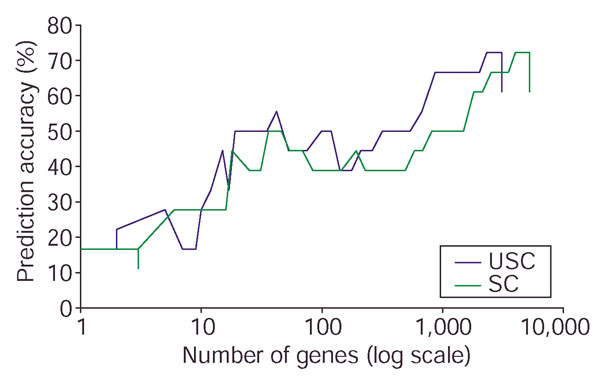
Comparison of prediction accuracy of USC and SC on the NCI 60 data. The percentage of prediction accuracy is plotted against the number of relevant genes using the USC algorithm at ρ0 = 0.6 and the SC algorithm (USC at ρ0 = 1.0). The horizontal axis is shown on a log scale. Because no independent test set is available for this data, we randomly divided the samples in each class into roughly three parts multiple times, such that a third of the samples are reserved as a test set. Thus the training set consists of 43 samples and the test set of 18 samples. The graph represents typical results over these multiple random runs.
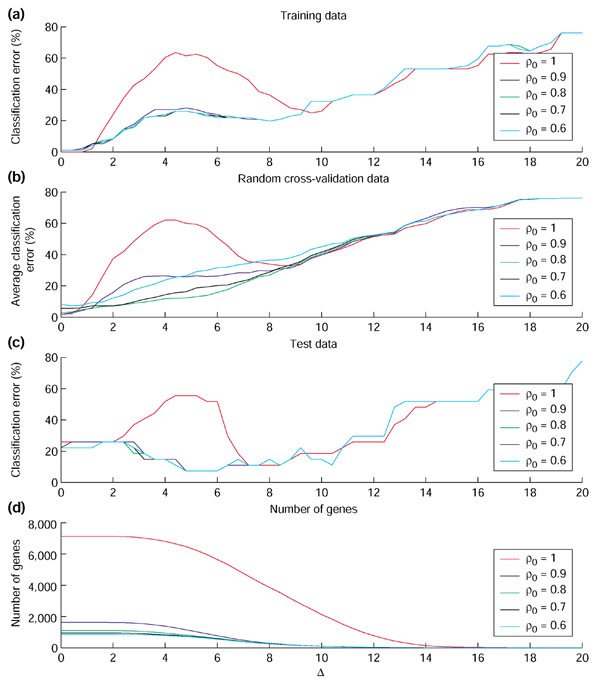
Prediction accuracy on the multiple tumor data using the EWUSC algorithm over the range of Δ from 0 to 20. The percentage of classification errors is plotted against Δ on (a) the full training set (96 samples) and (c) the test set (27 samples). In (b) the average percentage of errors is plotted against Δ on the cross-validation data over five random runs of fourfold cross-validation. In (d), the number of relevant genes is plotted against Δ. Different colors are used to specify different correlation thresholds (ρ0 = 0.6, 0.7, 0.8, 0.9 or 1). Results of ρ0 < 0.6 are shown in Figure S1 on [30]. Optimal parameters are inferred from the cross-validation data in (b).
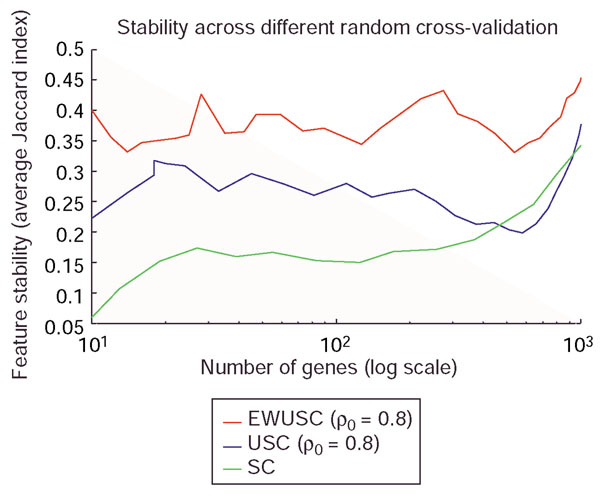
Comparison of feature stability of EWUSC, USC and SC on the multiple tumor data. The average Jaccard index is plotted against the number of relevant genes over five random runs of fourfold cross-validation using EWUSC and USC at ρ0 = 0.8 and SC. A high average Jaccard index indicates high feature stability. The EWUSC algorithm selects the most stable features. Note that the horizontal axis is shown on a log scale.
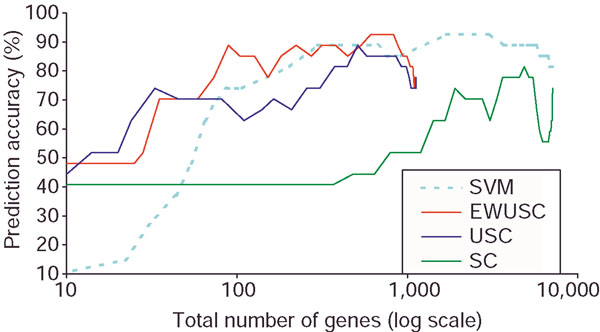
Comparison of prediction accuracy of EWUSC, USC, SVM and SC algorithms on the multiple tumor data. The horizontal axis shows the total number of distinct genes selected over all binary SVM classifiers on a log scale. Some results are not available on the full range of the total number of genes. For example, the maximum numbers of selected genes for EWUSC and USC are roughly 1,000. The reported prediction accuracy is 78% [10] using all 16,000 available genes on the full data. The EWUSC algorithm achieves 89% prediction accuracy with only 89 genes. With 680 genes, EWUSC produces 93% prediction accuracy.
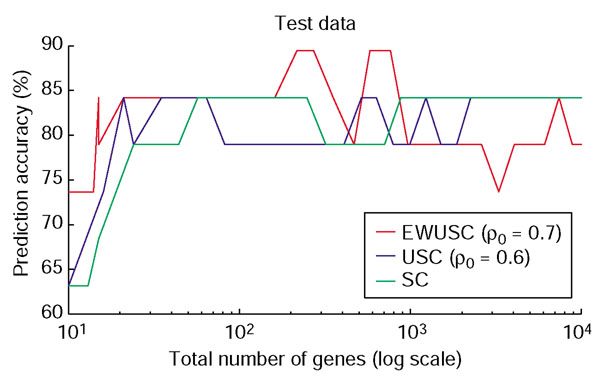
Comparison of prediction accuracy of EWUSC, USC and SC on the breast cancer data. The percentage of prediction accuracy is plotted against the number of relevant genes using the EWUSC algorithm at ρ0 = 0.7, the USC algorithm at ρ0 = 0.6 and the SC algorithm (USC at ρ0 = 1.0). Note that the horizontal axis is shown on a log scale.

Comparison of feature stability of EWUSC, USC and SC on the breast cancer data. The average Jaccard index is plotted against the number of relevant genes over five random runs of 10-fold cross-validation using the EWUSC algorithm at ρ0 = 0.7, the USC algorithm at ρ0 = 0.6 and the SC algorithm (USC at ρ0 = 1). The EWUSC algorithm produces relatively more stable features when the number of relevant genes is small.
Similar articles
-
New gene selection method for multiclass tumor classification by class centroid.J Biomed Inform. 2009 Feb;42(1):59-65. doi: 10.1016/j.jbi.2008.05.011. Epub 2008 Jun 17. J Biomed Inform. 2009. PMID: 18835752
-
Tumor classification and marker gene prediction by feature selection and fuzzy c-means clustering using microarray data.BMC Bioinformatics. 2003 Dec 2;4:60. doi: 10.1186/1471-2105-4-60. BMC Bioinformatics. 2003. PMID: 14651757 Free PMC article.
-
Automated Detection of Cancer Associated Genes Using a Combined Fuzzy-Rough-Set-Based F-Information and Water Swirl Algorithm of Human Gene Expression Data.PLoS One. 2016 Dec 9;11(12):e0167504. doi: 10.1371/journal.pone.0167504. eCollection 2016. PLoS One. 2016. PMID: 27936033 Free PMC article.
-
Key aspects of analyzing microarray gene-expression data.Pharmacogenomics. 2007 May;8(5):473-82. doi: 10.2217/14622416.8.5.473. Pharmacogenomics. 2007. PMID: 17465711 Review.
-
Predictive ability of DNA microarrays for cancer outcomes and correlates: an empirical assessment.Lancet. 2003 Nov 1;362(9394):1439-44. doi: 10.1016/S0140-6736(03)14686-7. Lancet. 2003. PMID: 14602436 Review.
Cited by
-
Establishing Novel Molecular Subtypes of Appendiceal Cancer.Ann Surg Oncol. 2022 Mar;29(3):2118-2125. doi: 10.1245/s10434-021-10945-8. Epub 2021 Oct 30. Ann Surg Oncol. 2022. PMID: 34718915
-
Developing a Predictive Gene Classifier for Autism Spectrum Disorders Based upon Differential Gene Expression Profiles of Phenotypic Subgroups.N Am J Med Sci (Boston). 2013;6(3):10.7156/najms.2013.0603107. doi: 10.7156/najms.2013.0603107. N Am J Med Sci (Boston). 2013. PMID: 24363828 Free PMC article.
-
Gene selection and classification of microarray data using random forest.BMC Bioinformatics. 2006 Jan 6;7:3. doi: 10.1186/1471-2105-7-3. BMC Bioinformatics. 2006. PMID: 16398926 Free PMC article.
-
Optimized between-group classification: a new jackknife-based gene selection procedure for genome-wide expression data.BMC Bioinformatics. 2005 Sep 28;6:239. doi: 10.1186/1471-2105-6-239. BMC Bioinformatics. 2005. PMID: 16191195 Free PMC article.
-
A Dual Level Analysis with Evolutionary Computing and Swarm Models for Classification of Leukemia.Biomed Res Int. 2022 May 26;2022:2052061. doi: 10.1155/2022/2052061. eCollection 2022. Biomed Res Int. 2022. PMID: 35663047 Free PMC article.
References
-
- Lennon GG, Lehrach H. Hybridization analyses of arrayed cDNA libraries. Trends Genet. 1991;7:314–317. - PubMed
-
- Pietu G, Alibert O, Guichard V, Lamy B, Bois F, Leroy E, Mariage-Sampson R, Houlgatte R, Soularue P, Auffray C. Novel gene transcripts preferentially expressed in human muscles revealed by quantitative hybridization of a high density cDNA array. Genome Res. 1996;6:492–503. - PubMed
-
- Schena M, Shalon D, Davis RW, Brown PO. Quantitative monitoring of gene expression patterns with a complementary DNA microarray. Science. 1995;270:467–470. - PubMed
-
- Lockhart DJ, Dong H, Byrne MC, Follettie MT, Gallo MV, Chee MS, Mittmann M, Wang C, Kobayashi M, Horton H, et al. Expression monitoring by hybridization to high-density oligonucleotide arrays. Nat Biotechnol. 1996;14:1675–1680. - PubMed
Publication types
MeSH terms
Grants and funding
LinkOut - more resources
Full Text Sources
Other Literature Sources
