. 2003 Dec;69(12):7499-506.
doi: 10.1128/AEM.69.12.7499-7506.2003.

Experimental examination of bacteriophage latent-period evolution as a response to bacterial availability

Affiliations

Experimental examination of bacteriophage latent-period evolution as a response to bacterial availability

Stephen T Abedon et al. Appl Environ Microbiol. 2003 Dec.

Abstract

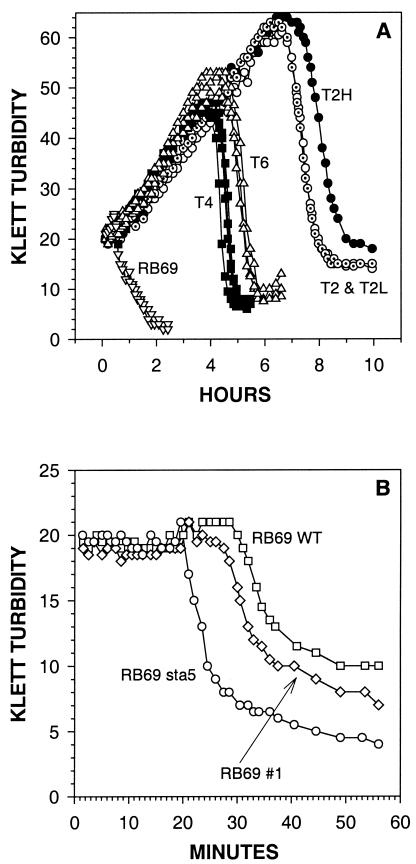
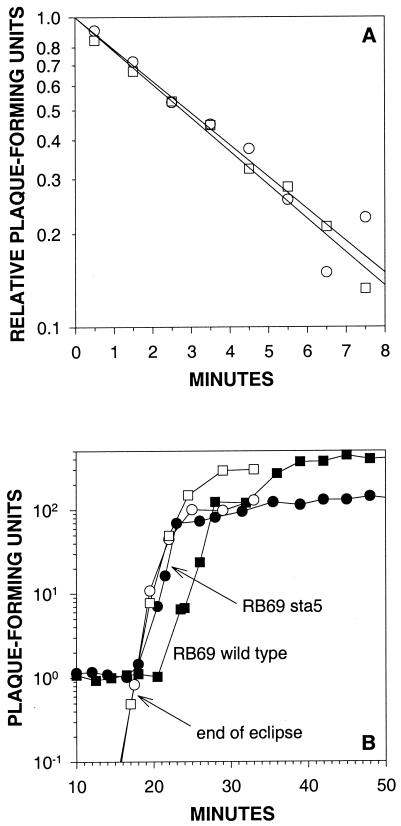
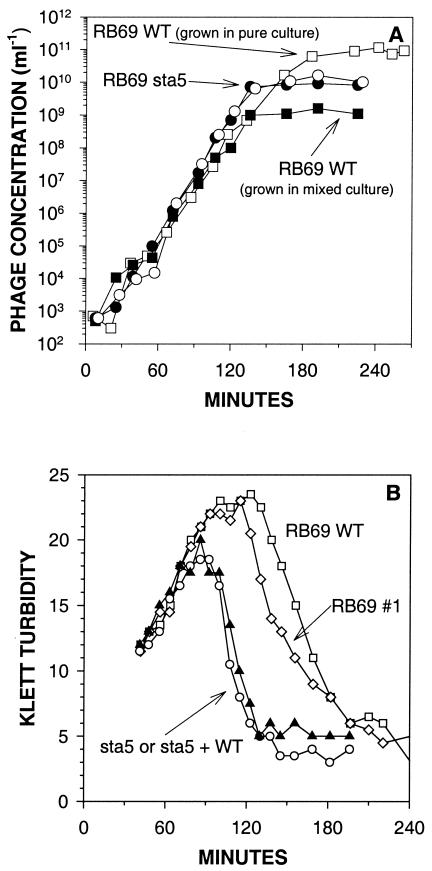
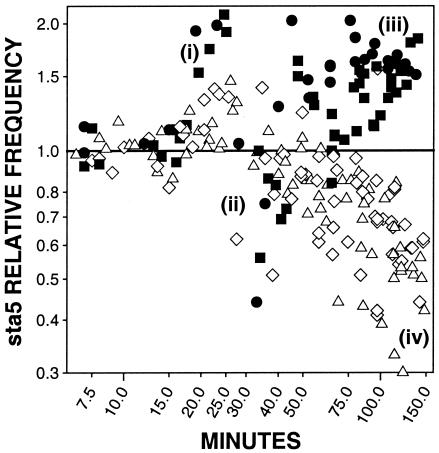
For obligately lytic bacteriophage (phage) a trade-off exists between fecundity (burst size) and latent period (a component of generation time). This trade-off occurs because release of phage progeny from infected bacteria coincides with destruction of the machinery necessary to produce more phage progeny. Here we employ phage mutants to explore issues of phage latent-period evolution as a function of the density of phage-susceptible bacteria. Theory suggests that higher bacterial densities should select for shorter phage latent periods. Consistently, we have found that higher host densities (>/== approximately 10(7) bacteria/ml) can enrich stocks of phage RB69 for variants that display shorter latent periods than the wild type. One such variant, dubbed sta5, displays a latent period that is approximately 70 to 80% of that of the wild type-which is nearly as short as the RB69 eclipse period-and which has a corresponding burst size that is approximately 30% of that of the wild type. We show that at higher host densities (>/== approximately 10(7) bacteria/ml) the sta5 phage can outcompete the RB69 wild type, though only under conditions of direct (same-culture) competition. We interpret this advantage as corresponding to slightly faster sta5 population growth, resulting in multifold increases in mutant frequency during same-culture growth. The sta5 advantage is lost, however, given indirect (different-culture) competition between the wild type and mutant or given same-culture competition but at lower densities of phage-susceptible bacteria (</= approximately 10(6) bacteria/ml). From these observations we suggest that phage displaying very short latent periods may be viewed as specialists for propagation when bacteria within cultures are highly prevalent and transmission between cultures is easily accomplished.


Figures

FIG. 1.
FIG. 1.
Lysis profiles. Phage were adsorbed to E. coli CR63 growing at a density of approximately 108/ml. (A) Phages added with a multiplicity of 10 include T2 (○), T2H (•), T2L (⊙), T4 (▪), T6 (▵), and RB69 (▿), with each curve representing a phage stock obtained from a different source. Turbidity declines are indicative of phage-induced lysis (3, 41), and lysis somewhat later than 0.5 h is indicative of lysis inhibition. Infected-bacterium growth without division is thought to explain the rise in turbidity (3, 18, 19). (B) Phage RB69 strains, added to bacteria with a multiplicity of 5, are as indicated.
FIG. 2.
FIG. 2.
RB69 sta5 phenotypic comparison. RB69 WT is shown as squares, while RB69 sta5 is shown as circles. (A) Phage adsorption to E. coli determined in broth via the chloroform-lysis method. (B) Single-step growth curve (solid symbols) with bacterial lysis induced by phage (lysis from within [41]) versus equivalent chloroform-lysis experiment run in parallel (open symbols).
FIG. 3.
FIG. 3.
Mixed- and pure-culture competition. Shown are RB69 WT (□), sta5 (○), and RB69 mutant #1 (⋄) growing from initially low densities (initial bacterial density of ∼107 bacteria/ml and initial phage multiplicity of ∼0.0001; e.g., as for phage stock preparation in broth). Pure cultures are shown as open symbols, and 1:1 sta5-WT mixed cultures are shown as solid symbols. Panels A and B represent experiments run on different days. Note that the sta5 mutant and WT phages produce plaques that are easily distinguished upon visual inspection (A).
FIG. 4.
FIG. 4.
Constant bacterial density competition. Log-phase E. coli was diluted to various densities in phage-containing fresh broth (to an initial phage density of ∼2 × 10³ PFU per ml) with cultures, then split 1:1 to fresh broth every 30 min. Relative phage densities, RB69 sta5 versus WT, were determined as for Fig. 3A and are presented as the fraction of sta5 mutant (large plaques/total plaques) relative to the sta5 fraction at time zero (i.e., the sta5 “relative frequency” or rel-freqsta5). Cultures are distinguished according to prelysis estimated arithmetic means of bacterial density: ≥107.6 (•), ≥106.6 (▪), ≥105.6 (⋄), and ≥ 104.6 (▵). Roman numerals refer to (i) expected timing of post-sta5 lysis and pre-WT lysis, (ii) expected timing of post-WT lysis, (iii) approximate timing of lysis of all bacteria in higher bacterial-density cultures, and (iv) an ongoing cohabitation of cultures by phage and bacteria at lower initial bacterial densities.
FIG. 5.
FIG. 5.
Phage RB69 gene t. At top is a comparison of T4's intergenic region (lowercase) with RB69's (uppercase). Boldfaced and underlined sequences are consistent with other T-even-like phages for which sequence is known (Fig. 6). Highlights of subsequent RB69 sequence (in order) are (i) start codons (note that the first 11 nucleotides of the reading frame starting with the second ATG are identical for all phages listed in Fig. 6, except AC3 and T2, for which this sequence is not known, and RB49 and 44RR2.8t, for which overall sequence is highly divergent), (ii) amino acid position 39 (Val in RB69, Iso in others), (iii) nucleotide position 535 (A in RB69 WT and G in sta5), and (iv) amino acid position 179 (Asn in WT and Asp in sta5). Translated, RB69's gene t shares 71.7% identity with phage T4's versus 72.1% identity at the nucleic acid level.
FIG. 6.
FIG. 6.
Comparison of 38-t intergenic region (shown unshaded). Presumptive gene t start codons (second start codon for phage RB69) and first gene-38 stop codons are shaded black. Double-underlined stop codons are in frame with gene 38, while other stop codons, not in frame, are singly underlined. The first RB69 start codon is shown unshaded but is boldfaced and underlined. Consensus sequence for phages T4, TuIb, and AC3 through T6 is shown as uppercase text. Sequences are arranged first by the similarity (at the DNA level) of their gene 38 (with T4 and TuIb's gene 38 both very different from those of phages RB69 through T6), with phage RB69 shown next, and with AC3 through T6 arranged alphabetically (and forming a second group based on gene 38 similarity). Also shown is the pseudo-T-even phage RB49 (13) and phage 44RR2.8t, which apparently do not possess a gene 38 in the same position as these other phages. Note that the RB69 gene 38 DNA sequence is not an outlier from the gene 38 sequence of phages AC3, AR1, K3, M1, Ox2, T2, and T6. Sequence references are shown parenthetically and in Materials and Methods.

Similar articles

Cited by

References

    1. Abedon, S. T. 1989. Selection for bacteriophage latent period length by bacterial density: a theoretical examination. Microb. Ecol. 18:79-88. - PubMed
    1. Abedon, S. T. 1990. Selection for lysis inhibition in bacteriophage. J. Theor. Biol. 146:501-511. - PubMed
    1. Abedon, S. T. 1992. Lysis of lysis-inhibited bacteriophage T4-infected cells. J. Bacteriol. 174:8073-8080. - PMC - PubMed
    1. Abedon, S. T. 1994. Lysis and the interaction between free phages and infected cells, p. 397-405. In J. D. Karam et al. (ed.), Molecular biology of bacteriophage T4. ASM Press, Washington, D.C.
    1. Abedon, S. T. 1999. Bacteriophage T4 resistance to lysis-inhibition collapse. Genet. Res. 74:1-11. - PubMed

Substances

Associated data