. 2003 Dec;112(11):1751-61.
doi: 10.1172/JCI17595.

Acute myeloid leukemia fusion proteins deregulate genes involved in stem cell maintenance and DNA repair

Affiliations

Acute myeloid leukemia fusion proteins deregulate genes involved in stem cell maintenance and DNA repair

Myriam Alcalay et al. J Clin Invest. 2003 Dec.

Abstract

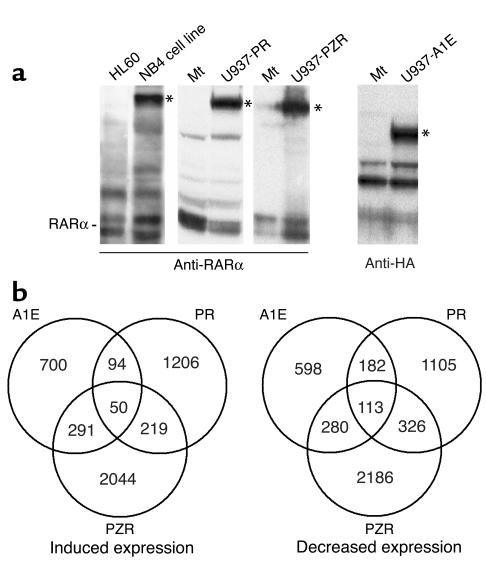
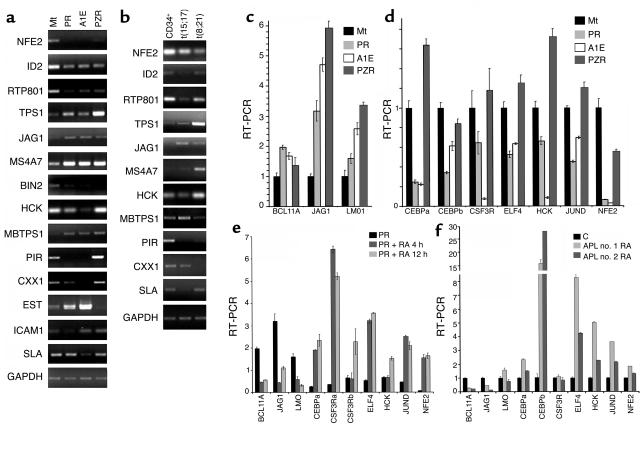
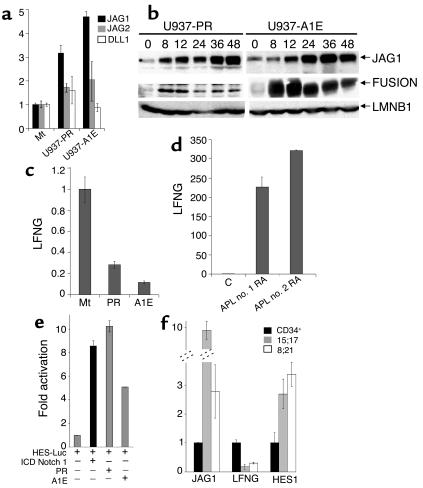
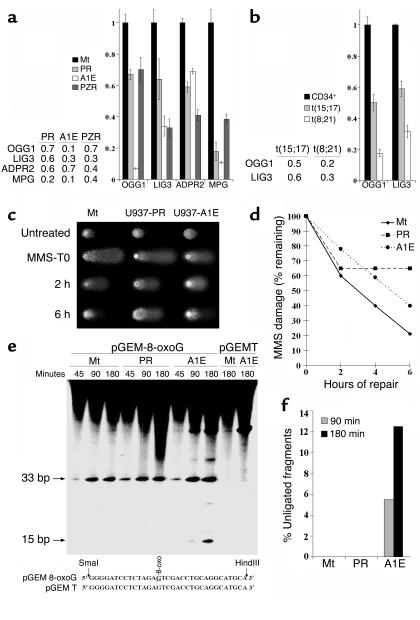
Acute myelogenous leukemias (AMLs) are genetically heterogeneous and characterized by chromosomal rearrangements that produce fusion proteins with aberrant transcriptional regulatory activities. Expression of AML fusion proteins in transgenic mice increases the risk of myeloid leukemias, suggesting that they induce a preleukemic state. The underlying molecular and biological mechanisms are, however, unknown. To address this issue, we performed a systematic analysis of fusion protein transcriptional targets. We expressed AML1/ETO, PML/RAR, and PLZF/RAR in U937 hemopoietic precursor cells and measured global gene expression using oligonucleotide chips. We identified 1,555 genes regulated concordantly by at least two fusion proteins that were further validated in patient samples and finally classified according to available functional information. Strikingly, we found that AML fusion proteins induce genes involved in the maintenance of the stem cell phenotype and repress DNA repair genes, mainly of the base excision repair pathway. Functional studies confirmed that ectopic expression of fusion proteins constitutively activates pathways leading to increased stem cell renewal (e.g., the Jagged1/Notch pathway) and provokes accumulation of DNA damage. We propose that expansion of the stem cell compartment and induction of a mutator phenotype are relevant features underlying the leukemic potential of AML-associated fusion proteins.


Figures

Figure 1
Figure 1
(a) Western blot analysis of fusion-protein expression in the U937 clones used in this study. Asterisks indicate bands corresponding to fusion proteins. The left panel shows PML/RAR levels in the NB4 cell line, which are comparable to those of the U937 PML/RAR and U937 PLZF/RAR cell lines after 8 hours of treatment with 100 μM ZnSO4. Endogenous RARα expression can be used to compare relative fusion-protein expression levels among different samples. Mt was the control. (b) Venn diagrams representing the overlaps among induced and repressed target genes. PR, PML/RAR; A1E, AML1/ETO; PZR, PLZF/RAR.
Figure 2
Figure 2
(a) Semiquantitative PCR analysis of 14 predicted targets. For each gene, the number of cycles required to detect a signal in the linear range was previously determined (see “Supplementary Methods,” ref.12). (b) Semiquantitative PCR analysis of AML blasts compared to CD34+ normal precursors of 11 targets identified in the U937 system. Relative mRNA levels of induced target genes (c) and of repressed target genes (d) in U937 PML/RAR, U937 AML1/ETO or U937 PLZF/RAR cells assessed by real time RT-PCR. Mt was the control used in panels a, c, and d. (e) Expression levels of common target genes in U937 PML/RAR cells before and after 4 or 8 hours of treatment with 10–6 M RA. Values are calculated relatively to expression levels in Mt cells receiving the same treatment. (f) Expression levels of common target genes in blasts derived form two APL patients (APL no. 1 and APL no. 2) after 4 hours of in vitro treatment with 10–6 M RA. All values are shown as compared to the control (C); i.e., expression levels in blasts from the same individual, prior to RA treatment. All experiments shown in this figure were performed in triplicate. One representative experiment is shown for semiquantiative PCRs (a and b), whereas an average value of the three results was plotted for real time RT-PCR data (cf). GAPDH gene expression was used to normalize all experiments.
Figure 3
Figure 3
(a) mRNA levels of Notch ligands in Mt, U937-PML/RAR and U937-AML1/ETO cells, assessed by real time RT-PCR. Relative expression levels are shown. (b) Western blot analysis of Jagged1 protein expression in U937-PML/RAR and U937-AML1/ETO cells treated with 100 μM ZnSO4 for the indicated number of hours. Jagged1 levels are shown in the top row, fusion protein expression in the middle row and lamin B expression in the bottom row. Jagged1 expression in Mt cells was not modified by ZnSO4 treatment (data not shown). (c) Relative mRNA levels of LFNG in U937 PML/RAR and U937 AML1/ETO cells. Mt was the control in panels a and c. (d) LFNG mRNA levels dramatically increase after RA treatment in vitro of blasts from two different APL patients, as compared to the control (C); i.e., the same cells prior to treatment. (e) Expression of PML/RAR or AML1/ETO in HeLa cells increases the activity of a Notch 1-responsive promoter. All values are plotted as relative fold activation. The black bar shows HES-Luc transactivation by an activated, intracellular domain of Notch 1 (ICD Notch1). (f) Relative expression of JAG1, LFNG and HES1 genes in blasts bearing the t(15;17) or the t(8;21) compared to CD34+ cells, assayed by real time RT-PCR. The results shown are the average values obtained from cells derived from 7 different individuals for each condition. All RT-PCR data shown in this figure represents the average values of three independent measurements. GAPDH gene expression was used for normalization. Fold mRNAs are calculated from real time curves.
Figure 4
Figure 4
(a) The mRNA levels of OGG1, LIG3, ADPR2, and MPG in U937 PML/RAR, U937 AML1/ETO, or U937 PLZF/RAR cells, compared with Mt were assessed by real-time RT-PCR. Shown are average fold change values as calculated by real-time RT-PCR. (b) Relative expression of OGG1 and LIG3 genes in blasts bearing t(15;17) or t(8;21) compared with CD34+ cells, determined by real time RT-PCR. The results shown are the average values obtained from cells derived from seven different individuals for each condition. Shown are average fold change values as calculated by real-time RT-PCR. (c) Representative images were taken from alkaline comet assays of Mt, U937-PML/RAR and U937-AML1/ETO cells before treatment (Untreated) immediately after treatment with 200 μM MMS for two hours (T0), and 2 and 6 hours after removal of MMS. (d) Median relative tail moment of more than 50 cells for each data point, calculated by comparison with the total score (100%) of initial DNA damage induced by MMS treatment. (e) In vitro BER assay. See text for detailed explanation. (f) Relative amount of unligated fragments. Data are the means of four independent experiments. For all experiments, both fusion protein–expressing U937 cells and control cells were treated with 100 μM ZnSO4 for 8 hours to allow for maximal fusion protein expression. Mt was the control for panels a, cf.

References

    1. Mitelman, F. 1994. Catalogue of chromosome aberrations in Cancer. Wiley-Liss. New York, New York, USA. 4252 pp.
    1. Look AT. Oncogenic transcription factors in the human acute leukemias. Science. 1997; 278:1059–1064. - PubMed
    1. Alcalay M, et al. Common themes in the pathogenesis of acute myeloid leukemia. Oncogene. 2001; 20:5680–5694. - PubMed
    1. Grignani F, et al. The acute promyelocytic leukemia-specific PML-RAR alpha fusion protein inhibits differentiation and promotes survival of myeloid precursor cells. Cell. 1993; 74:423–431. - PubMed
    1. Gelmetti V, et al. Aberrant recruitment of the nuclear receptor corepressor-histone deacetylase complex by the acute myeloid leukemia fusion partner ETO. Mol. Cell Biol. 1998; 18:7185–7191. - PMC - PubMed

Publication types

MeSH terms

Substances