. 2004 Mar 5;279(10):9557-64.
doi: 10.1074/jbc.M310512200. Epub 2003 Dec 8.

ATP-citrate lyase deficiency in the mouse

Affiliations

ATP-citrate lyase deficiency in the mouse

Anne P Beigneux et al. J Biol Chem. .

Abstract

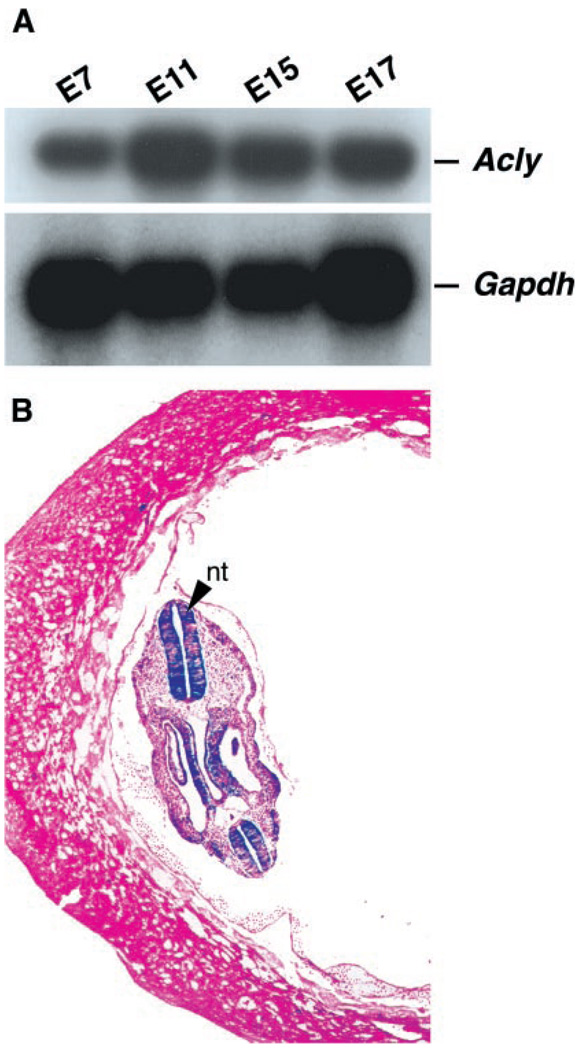
ATP-citrate lyase (Acly) is one of two cytosolic enzymes that synthesize acetyl-coenzyme A (CoA). Because acetyl-CoA is an essential building block for cholesterol and triglycerides, Acly has been considered a therapeutic target for hyperlipidemias and obesity. To define the phenotype of Acly-deficient mice, we created Acly knockout mice in which a beta-galactosidase marker is expressed from Acly regulatory sequences. We also sought to define the cell type-specific expression patterns of Acly to further elucidate the in vivo roles of the enzyme. Homozygous Acly knockout mice died early in development. Heterozygous mice were healthy, fertile, and normolipidemic on both chow and high fat diets, despite expressing half-normal amounts of Acly mRNA and protein. Fibroblasts and hepatocytes from heterozygous Acly mice contained half-normal amounts of Acly mRNA and protein, but this did not perturb triglyceride and cholesterol synthesis or the expression of lipid biosynthetic genes regulated by sterol regulatory element-binding proteins. The expression of acetyl-CoA synthetase 1, another cytosolic enzyme for producing acetyl-CoA, was not up-regulated. As judged by beta-galactosidase staining, Acly was expressed ubiquitously but was expressed particularly highly in tissues with high levels of lipogenesis, such as in the livers of mice fed a high-carbohydrate diet. beta-Galactosidase staining was intense in the developing brain, in keeping with the high levels of de novo lipogenesis of the tissue. In the adult brain, beta-galactosidase staining was in general much lower, consistent with reduced levels of lipogenesis; however, beta-galactosidase expression remained very high in cholinergic neurons, likely reflecting the importance of Acly in generating acetyl-CoA for acetylcholine synthesis. The Acly knockout allele is useful for identifying cell types with a high demand for acetyl-CoA synthesis.


Figures

Fig. 1
Fig. 1. Insertional mutation in Acly
A, schematic of the insertional mutation in Acly. Cell lines and mice were genotyped by Southern blot with a 5′ flanking probe. Black boxes represent exons. SA, splice acceptor; SV40pA, simian virus poly adenylation signal sequence. B, Northern blot of total RNA from liver, heart, white adipose tissue (WAT), kidney, and brain of Acly+/+ and Acly+/− mice. Three probes were used: an Acly cDNA, a β-galactosidase cDNA, and an 18S cDNA (for normalization). C, Western blot of protein extracts from liver, WAT, kidney, and brain of Acly+/+ and Acly+/− mice with an Acly-specific antiserum.
Fig. 2
Fig. 2. Expression of Acly during development
A, mouse embryo poly(A)+ RNA blot demonstrating that Acly is expressed throughout development. B, β-galactosidase staining of an 8.5-dpc Acly+/− embryo showing very high levels of Acly expression in the neural tube (nt). Original magnification, ×4.
Fig. 3
Fig. 3. Acly mRNA, protein, and activity levels in Acly+/+ and Acly+/− primary fibroblasts
A, Northern blot of total RNA from embryonic fibroblasts. Three probes were used: an Acly cDNA, an Acs1 cDNA, and an 18S cDNA (for normalization). B, Western blot of protein extracts from embryonic fibroblasts with an Acly-specific antiserum. C, cholesterol and triglyceride synthesis in embryonic fibroblasts. Cholesterol and triglyceride synthesis rates in Acly+/− cells are expressed as a percentage of those in Acly+/+ cells. The levels of incorporation into cholesterol in wild-type cells were: 2,289 cpm/mg of protein for [1,5-14C]citric acid and 108,626 cpm/mg of protein for [1-14C]acetic acid. The levels of incorporation into triglycerides in wild-type cells were: 34,560 cpm/mg of protein for [1(3)-3H]glycerol and 26,882 cpm/mg of protein for [1-14C]acetic acid. Data represent the average of duplicate determinations, and each experiment was repeated twice. D, relative amount of mRNAs coding for a variety of enzymes involved in triglyceride, cholesterol, and glucose metabolism in Acly+/+ and Acly+/− embryonic fibroblasts. Total RNA was prepared from three cell lines per genotype. Equal aliquots were pooled according to genotype and analyzed by quantitative reverse transcription- PCR. Gapdh was used as a control in this experiment, although a cyclophilin control yielded virtually identical results. Values represent the relative amount of mRNA in relation to that measured in Acly+/+ fibroblasts. Acc, acetyl-CoA carboxylase; Fas, fatty acid synthase; Scd1, stearoyl-CoA desaturase 1; Gpat, glycerol-3-phosphate-acyltransferase; Lce, long-chain fatty acyl elongase; G6pc, glucose-6-phosphatase, catalytic; Gck, glucokinase; G6pd, glucose-6-phosphate dehydrogenase; Me, malic enzyme; Hmgcs, 3-hydroxy-3-methylglutaryl-CoA synthase; Hmgcr, 3-hydroxy-3-methylglutaryl-CoA reductase.
Fig. 4
Fig. 4. Levels of cholesterol and triglyceride synthesis in primary hepatocytes from Acly+/+ and Acly+/− mice
Cholesterol and triglyceride synthesis rates in Acly+/− cells are expressed as a percentage of those in Acly+/+ cells. The levels of incorporation of [1(3)-3H]glycerol into cholesterol and triglycerides in wild-type cells were 583 ± 33 cpm/µg of protein and 56,085 ± 2,919 cpm/µg of protein, respectively. Data represent the average of triplicate determinations, and each experiment was repeated twice.
Fig. 5
Fig. 5. Expression of Acly, Acs1, and lipid biosynthetic genes in liver from Acly+/+ and Acly+/− mice
A, relative amount of mRNAs coding for a variety of enzymes involved in triglyceride, cholesterol, and glucose metabolism in the livers of Acly+/+ and Acly+/− mice. Reverse transcriptase-PCR was performed as described in the legend to Fig. 3D. B, Northern blot of total RNA from liver. Three probes were used: Acly cDNA, Acs1 cDNA, and 18S cDNA (for normalization).
Fig. 6
Fig. 6. Tissue pattern of Acly expression in adult mice and regulation of Acly expression in liver by diet
A, mouse multiple-tissue poly(A)+ RNA blot showing Acly expression in the tissues of wild-type mice. A Gapdh cDNA was used for normalization. B, β-galactosidase staining of testis from a 4-week-old Acly+/− mouse, showing intense staining in Leydig cells. Original magnification, ×20. At higher power, less-intense staining of the Sertoli cells was also apparent. The same pattern of cellular expression was observed in testis from 7- and 36-week-old mice. C, β-galactosidase staining of a section of Acly+/− kidney. Original magnification, ×10. Arrows indicate tubules. DF, β-galactosidase staining of liver from Acly+/− adult mice fed a chow diet (D), a fat-free, carbohydrate-rich diet (E), or a Western diet (F). Original magnification, ×10. G, Northern blot analysis of total RNA from the liver of Acly+/+ mice on the three different diets. Two probes were used: Acly cDNA and 18S cDNA (for normalization).
Fig. 7
Fig. 7. Evolution of Acly expression in the maturing brain
A–D, β-galactosidase staining of sagittal sections of brains from a 15-dpc Acly+/− embryo (A), 1-day-old Acly+/− mouse (B), a 3-week-old Acly+/− mouse (C), and a 6-month-old Acly+/− mouse (D). Original magnifications, ×2 (A and B) and ×1 (C and D). Arrows indicate hippocampus (h), granular layer of the cerebellum (gr), nuclei of pons (p), and facial nucleus (f).
Fig. 8
Fig. 8. Acly is expressed in glial cells and in neurons in the adult mouse nervous system
A and B, β-galactosidase and immunohistochemical staining of adult Acly+/− thalamus (A) and cortex (B). Specific antibodies against glial fibrillary acidic protein (A) and neuronal nuclei (B) were used. C, β-galactosidase staining of adult Acly+/− spinal cord (cervical). Arrow indicates ventral horn. D, immunohistochemical staining of adult Acly+/− spinal cord (cervical) with a specific antibody against neuronal nuclei. Original magnifications, ×40 (A and B) and ×4 (C and D).
Fig. 9
Fig. 9. Acly is expressed in cholinergic neurons in the adult mouse brain
A, β-galactosidase staining of a sagittal section of adult Acly+/− hippocampus. B, immunohistochemical staining of adult Acly+/− hippocampus with a specific antibody against choline acetyltransferase. CH, β-galactosidase and immunohistochemical staining of adult Acly+/− hippocampus (C), pons nuclei (D), cerebellum (E), cerebellar nuclei (F), and medulla (facial nucleus) (G and H). Specific antibodies against vesicular acetylcholine transporter (C, E, and H), choline acetyltransferase (F), or neuronal nuclei (D and G) were used. Original magnifications, ×10 (AC and E), ×20 (F), and ×40 (D, G, and H).

References

    1. Knowles SE, Jarrett IG, Filsell OH, Ballard FJ. Biochem. J. 1974;142:401–411. - PMC - PubMed
    1. Luong A, Hannah VC, Brown MS, Goldstein JL. J. Biol. Chem. 2000;275:26458–26466. - PubMed
    1. Liang G, Yang J, Horton JD, Hammer RE, Goldstein JL, Brown MS. J. Biol. Chem. 2002;277:9520–9528. - PubMed
    1. Sullivan AC, Triscari J, Hamilton JG, Miller ON, Wheatley VR. Lipids. 1974;9:121–128. - PubMed
    1. Bray GA, Greenway FL. Clin. Endocrinol. Metab. 1976;5:455–479. - PubMed

Publication types

Substances