. 2003 Dec 23;100(26):15776-81.
doi: 10.1073/pnas.2136655100. Epub 2003 Dec 8.

Cap analysis gene expression for high-throughput analysis of transcriptional starting point and identification of promoter usage

Affiliations

Cap analysis gene expression for high-throughput analysis of transcriptional starting point and identification of promoter usage

Toshiyuki Shiraki et al. Proc Natl Acad Sci U S A. .

Abstract

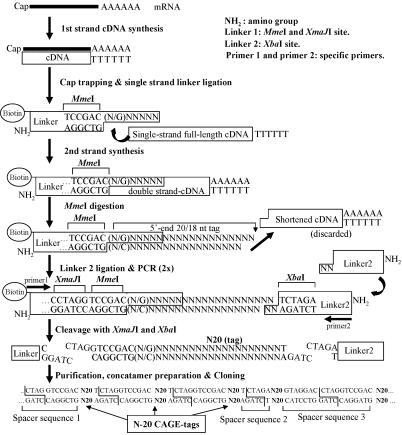
We introduce cap analysis gene expression (CAGE), which is based on preparation and sequencing of concatamers of DNA tags deriving from the initial 20 nucleotides from 5' end mRNAs. CAGE allows high-throughout gene expression analysis and the profiling of transcriptional start points (TSP), including promoter usage analysis. By analyzing four libraries (brain, cortex, hippocampus, and cerebellum), we redefined more accurately the TSPs of 11-27% of the analyzed transcriptional units that were hit. The frequency of CAGE tags correlates well with results from other analyses, such as serial analysis of gene expression, and furthermore maps the TSPs more accurately, including in tissue-specific cases. The high-throughput nature of this technology paves the way for understanding gene networks via correlation of promoter usage and gene transcriptional factor expression.


Figures

Fig. 1.
Fig. 1.
Schematic procedure of the CAGE protocol as detailed in Methods.
Fig. 2.
Fig. 2.
Starting-point identification for the Carboxypeptidase E gene. (A) In-field arrows within an ensembl screenshot show TSPs detected by CAGE tags from the four libraries. The thick arrows show the main TSP for all tissues. TSP shows specificity only for cerebellum. (B) Alignment of promoter-predicted elements for 1,200 nt upstream to 63,611,500. Arrows 1 and 2 indicate the main two TSPs from A. Significance increases from green (lowest), red, and blue, to black (highest).

References

    1. Mouse Genome Sequencing Consortium (2002) Nature 420, 520-562. - PubMed
    1. Carninci, P., Waki, K., Shiraki, T., Konno, H., Shibata, K., Itoh, M., Aizawa, K., Arakawa, T., Ishii, Y., Sasaki, D., et al. (2003) Genome Res. 13, 1273-1289. - PMC - PubMed
    1. Suzuki, Y., Tsunoda, T., Sese, J., Taira, H., Mizushima-Sugano, J., Hata, H., Ota, T., Isogai, T., Tanaka, T., Nakamura, Y., et al. (2001) Genome Res. 11, 677-684. - PMC - PubMed
    1. Ueda, H. R., Chen, W., Adachi, A., Wakamatsu, H., Hayashi, S., Takasugi, T., Nagano, M., Nakahama, K., Suzuki, Y., Sugano, S., et al. (2002) Nature 418, 534-539. - PubMed
    1. Zavolan, M., Kondo, S., Schonbach, C., Adachi, J., Hume, D. A., RIKEN GER Group, GSL Members, Hayashizaki, Y. & Gaasterland, T. (2003) Genome Res. 13, 1290-1300. - PMC - PubMed

Publication types

LinkOut - more resources