. 2003 Dec;2(6):1253-65.
doi: 10.1128/EC.2.6.1253-1265.2003.

Use of cDNA microarrays to monitor transcriptional responses of the chestnut blight fungus Cryphonectria parasitica to infection by virulence-attenuating hypoviruses

Affiliations

Use of cDNA microarrays to monitor transcriptional responses of the chestnut blight fungus Cryphonectria parasitica to infection by virulence-attenuating hypoviruses

Todd D Allen et al. Eukaryot Cell. 2003 Dec.

Abstract

Hypoviruses are a family of cytoplasmically replicating RNA viruses of the chestnut blight fungus Cryphonectria parasitica. Members of this mycovirus family persistently alter virulence (hypovirulence) and related fungal developmental processes, including asexual and sexual sporulation. In order to gain a better understanding of the molecular basis for these changes, we have developed a C. parasitica cDNA microarray to monitor global transcriptional responses to hypovirus infection. In this report, a spotted DNA microarray representing approximately 2,200 C. parasitica genes was used to monitor changes in the transcriptional profile after infection by the prototypic hypovirus CHV1-EP713. Altered transcript abundance was identified for 295 clones (13.4% of the 2,200 unique cDNAs) as a result of CHV1-EP713 infection-132 up-regulated and 163 down-regulated. In comparison, less than 20 specific C. parasitica genes were previously identified by Northern analysis and mRNA differential display as being responsive to hypovirus infection. A 93% validation rate was achieved between real-time reverse transcription-PCR results and microarray predictions. Differentially expressed genes represented a broad spectrum of biological functions, including stress responses, carbon metabolism, and transcriptional regulation. These findings are consistent with the view that infection by a 12.7-kbp hypovirus RNA results in a persistent reprogramming of a significant portion of the C. parasitica transcriptome. The potential impact of microarray studies on current and future efforts to establish links between hypovirus-mediated changes in cellular gene expression and phenotypes is discussed.


Figures

FIG. 1.
FIG. 1.
Scatter plot of four independent hybridizations comparing fluorescence-labeled cDNA probes derived from uninfected strain EP155 and from infected strain EP155/CHV1-EP713. Normalized signals for each channel are plotted on a logarithmic scale. Red triangles represent clones for which transcript accumulation increased in EP155/CHV1-EP713 relative to EP155. Green circles represent clones for which transcript accumulation decreased in EP155/CHV1-EP713 relative to EP155. Clones for which transcript levels did not significantly change after hypovirus infection are represented by yellow squares. Hybridizations 1 and 1R are dye-swap experiments done with the same RNA preparations from EP155 and EP155/CHV1-EP713. Hybridizations 2 and 2R are dye-swap experiments done with samples from a second, independent RNA isolation. Shaded red triangles in each data set indicate the magnitude of differential expression for hypovirus-encoded protein p48. Shaded green circles indicate the magnitude of differential expression for clone AEST-05-C-02.
FIG. 2.
FIG. 2.
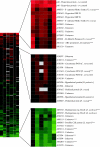
Hiearchical clustering of 295 differentially expressed clones (see Materials and Methods). Each clone is represented twice on the chip. Red squares indicate clones with increased transcript abundance and green squares indicate clones with decreased abundance after hypovirus infection. Gray blocks indicate missing data; black blocks indicate no differential gene expression. Each row represents six independent transcript abundance measurements for a specific clone. Each column represents a different hybrization experiment. Clones marked with asterisks were confirmed by real-time RT-PCR (Table 2). “A” in clone designations represents “AEST”; +, positive; Meth. Synth., methionine synthetase; Prot., protein; ABC, ATP-binding cassette; reg., regulation.

References

    1. Aranda, M. A., M. Escaler, D. Wang, and A. J. Maule. 1996. Induction of HSP70 and polyubiquitin expression associated with plant virus replication. Proc. Natl. Acad. Sci. USA 93:15289-15293. - PMC - PubMed
    1. Buck, K. W. (ed.). 1986. Fungal virology—an overview, p. 2-84. CRC Press, Inc., Boca Raton, Fla.
    1. Bustin, S. A. 2002. Quantification of mRNA using real-time reverse transcription PCR (RT-PCR): trends and problems. J. Mol. Endocrinol. 29:23-39. - PubMed
    1. Chattopadhyay, M. K., C. W. Tabor, and H. Tabor. 2002. Absolute requirement of spermidine for growth and cell cycle progression of fission yeast (Schizosaccharomyces pombe). Proc. Natl. Acad. Sci. USA 93:10330-10334. - PMC - PubMed
    1. Chen, B., S. Gao, G. H. Choi, and D. L. Nuss. 1996. Extensive alteration of fungal gene transcript accumulation and elevation of G-protein-regulated cAMP levels by a virulence-attenuating hypovirus. Proc. Natl. Acad. Sci. USA 93:7996-8000. - PMC - PubMed

Publication types

LinkOut - more resources