

Differential survival of solitary and aggregated bacterial cells promotes aggregate formation on leaf surfaces
- PMID: 14665692
- PMCID: PMC307678
- DOI: 10.1073/pnas.2436560100
Differential survival of solitary and aggregated bacterial cells promotes aggregate formation on leaf surfaces
Abstract
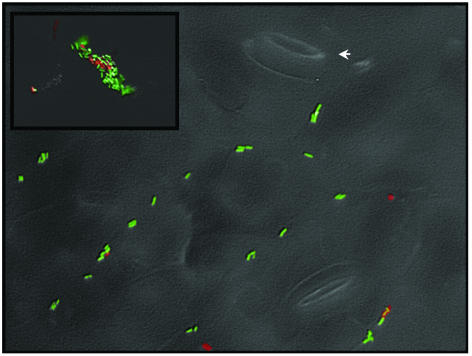
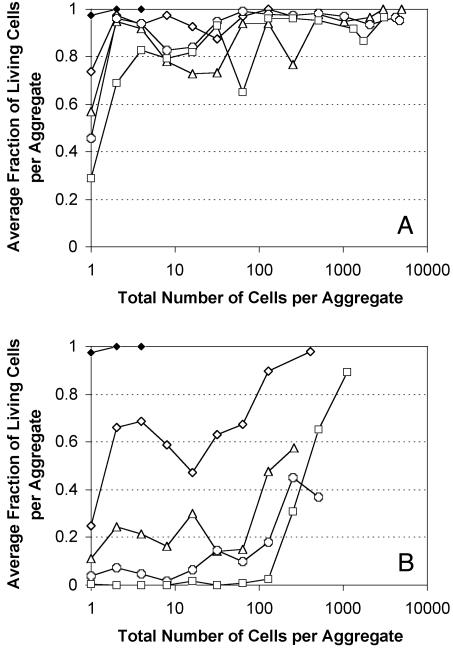
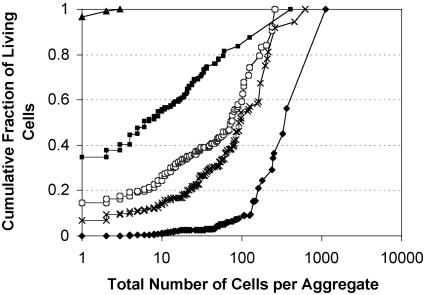
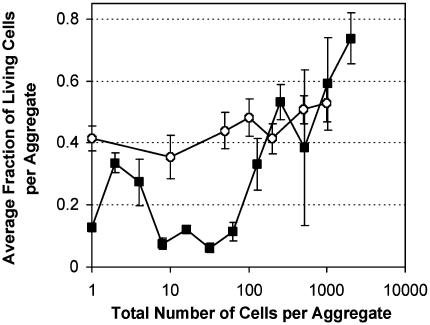
The survival of individual Pseudomonas syringae cells was determined on bean leaf surfaces maintained under humid conditions or periodically exposed to desiccation stress. Cells of P. syringae strain B728a harboring a GFP marker gene were visualized by epifluorescence microscopy, either directly in situ or after recovery from leaves, and dead cells were identified as those that were stained with propidium iodide in such populations. Under moist, conducive conditions on plants, the proportion of total live cells was always high, irrespective of their aggregated state. In contrast, the proportion of the total cells that remained alive on leaves that were periodically exposed to desiccation stress decreased through time and was only approximately 15% after 5 days. However, the fraction of cells in large aggregates that were alive on such plants in both condition was much higher than more solitary cells. Immediately after inoculation, cells were randomly distributed over the leaf surface and no aggregates were observed. However, a very aggregated pattern of colonization was apparent within 7 days, and >90% of the living cells were located in aggregates of 100 cells or more. Our results strongly suggest that, although conducive conditions favor aggregate formation, such cells are much more capable of tolerating environmental stresses, and the preferential survival of cells in aggregates promotes a highly clustered spatial distribution of bacteria on leaf surfaces.
Figures
References
-
- Fett, W. F. (2000) J. Food Protect. 63, 625-632. - PubMed
-
- Gras, M. H., Druet-Michaud, C. & Cerf, O. (1994) Sci. Aliments 14, 173-188.
-
- Monier, J.-M. & Lindow, S. E. (2003) Appl. Environ. Microbiol., in press.
Publication types
MeSH terms
Substances
LinkOut - more resources
Full Text Sources
Other Literature Sources
