. 2004 Feb;15(2):851-60.
doi: 10.1091/mbc.e03-08-0569. Epub 2003 Dec 10.

Global gene expression responses of fission yeast to ionizing radiation

Affiliations

Global gene expression responses of fission yeast to ionizing radiation

Adam Watson et al. Mol Biol Cell. 2004 Feb.

Abstract

A coordinated transcriptional response to DNA-damaging agents is required to maintain genome stability. We have examined the global gene expression responses of the fission yeast Schizosaccharomyces pombe to ionizing radiation (IR) by using DNA microarrays. We identified approximately 200 genes whose transcript levels were significantly altered at least twofold in response to 500 Gy of gamma IR in a temporally defined manner. The majority of induced genes were core environmental stress response genes, whereas the remaining genes define a transcriptional response to DNA damage in fission yeast. Surprisingly, few DNA repair and checkpoint genes were transcriptionally modulated in response to IR. We define a role for the stress-activated mitogen-activated protein kinase Sty1/Spc1 and the DNA damage checkpoint kinase Rad3 in regulating core environmental stress response genes and IR-specific response genes, both independently and in concert. These findings suggest a complex network of regulatory pathways coordinate gene expression responses to IR in eukaryotes.


Figures
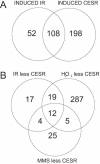
Figure 1.
Figure 1.
Induced IR genes are involved in a variety of cellular functions. (A) Venn diagram comparison of genes induced twofold or more in WT cells in response to 500 Gy of gamma IR (INDUCED IR) (this study) with genes induced in response to all, or most, environmental stresses (INDUCED CESR) (Chen et al., 2003). The number of genes common to these groups is shown within the overlapping circular regions. (B) Venn diagram comparison of non-CESR genes induced twofold or more in WT cells in response to 500 Gy of gamma IR (IR less CESR) (this study) with non-CESR genes induced twofold or more in WT cells in response to H2O2 (H2O2 less CESR) and non-CESR genes induced twofold or more in WT cells in response to MMS (MMS less CESR) (Chen et al., 2003). The number of common genes within these groups are shown within the overlapping circular regions.
Figure 2.
Figure 2.
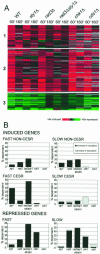
Regulation of gene expression during exposure to ionizing radiation. (A). The expression patterns of ∼200 genes whose transcript levels changed significantly more than twofold after exposure to 500 Gy of gamma IR in WT cells are shown. The columns in the figure represent samples taken at 60 min (60′) and 160 min (160′) after IR treatment in WT, sty1Δ, rad3Δ, rad3Δsty1Δ, chk1Δ, and cds1Δ cells. Analysis was subdivided into induced non-CESR genes (1; 51 genes), induced CESR genes (2; 96 genes), and repressed genes (3; 44 genes). Hierarchical clustering was performed as described in MATERIALS AND METHODS. The fold changes in transcript levels relative to the untreated levels are color coded with induced genes as red, repressed genes as green, no change as black, and missing data points as gray. The fold change in transcript abundance is indicated by the key at the bottom of the figure. Genes with missing data for >50% of the samples are not shown. (B) Analysis of the number of genes whose expression response to IR is dependent on the DNA checkpoint and/or stress response transduction kinases. Histograms depicting the percentage (% dependent) of induced non-CESR genes (top), CESR genes (middle), and repressed genes (bottom), which exhibited a twofold or more expression difference in sty1Δ, rad3Δ, rad3Δsty1Δ, chk1Δ, and cds1Δ strains compared with WT after 60 min (FAST; left) and 160 min (SLOW; right) after initiating exposure to 500 Gy of gamma IR. Black bars indicate percentage where induction/repression level is one-half or less in the mutant cells compared with WT cells (decrease in modulation). Gray bars indicate the percentage where induction/repression level is twofold or more in the mutant cells compared with WT cells (increase in modulation).
Figure 3.
Figure 3.
Comparison of gene expression patterns in asynchronous and G2 synchronized cells after exposure to 500 Gy of gamma IR. (A) Venn diagram comparison of genes induced twofold or more in asynchronous wild-type cells (asynchronous WT) with genes induced twofold or more in G2-synchronized wild-type cells (G2 synchronized WT) in response to 500 Gy of gamma IR as determined by microarray analysis. The number of common genes within these groups is shown within the overlapping circular regions. (B) Venn diagram comparison of genes induced twofold or more in G2-synchronized wild-type cells (G2 synchronized WT) in response to 500 Gy of gamma IR (this study) with CESR genes, each induced twofold or more in WT cells in response to a variety of environmental stresses (Chen et al., 2003). The number of common genes within these groups is shown within the overlapping circular regions. Gene identities are available from our Website. (C) Expression profiles of cdc10+ target genes cdt1+, cdt2+, cdc18+, and cdc22+ after irradiation of asynchronous cells and (D) the expression of these genes in G2-synchronized cells.
Figure 4.
Figure 4.
Regulation of gene expression in response to ionizing radiation in fission yeast. The relative contribution of the Sty1 stress response and Rad3 checkpoint kinases in coordinating CESR and non-CESR gene expression responses are indicated. Unknown regulatory pathways are indicated. See text for details.

References

    1. Aboussekhra, A., Vialard, J.E., Morrison, D.E., de la Torre-Ruiz, M.A., Cernakova, L., Fabre, F., and Lowndes, N.F. (1996). A novel role for the budding yeast RAD9 checkpoint gene in DNA damage-dependent transcription. EMBO J. 15, 3912-3922. - PMC - PubMed
    1. Allen, J.B., Zhou, Z., Siede, W., Friedberg, E.C., and Elledge, S.J. (1994). The SAD1/RAD53 protein kinase controls multiple checkpoints and DNA damage-induced transcription in yeast. Genes Dev. 8, 2401-2415. - PubMed
    1. Anderson, M., Ng, S.S., Marchesi, V., MacIver, F.H., Stevens, F.E., Riddell, T., Glover, D.M., Hagan, I.M., and McInerny, C.J. (2002). Plo1(+) regulates gene transcription at the M-G(1) interval during the fission yeast mitotic cell cycle. EMBO J. 21, 5745-5755. - PMC - PubMed
    1. Aves, S.J., Durkacz, B.W., Carr, A., and Nurse, P. (1985). Cloning, sequencing and transcriptional control of the Schizosaccharomyces pombe cdc10 `start' gene. EMBO J. 4, 457-463. - PMC - PubMed
    1. Bang, D.D., Ketting, R., de Ruijter, M., Brandsma, J.A., Verhage, R.A., van de Putte, P., and Brouwer, J. (1996). Cloning of Schizosaccharomyces pombe rph16+, a gene homologous to the Saccharomyces cerevisiae RAD16 gene. Mutat. Res. 364, 57-71. - PubMed

Publication types

MeSH terms

LinkOut - more resources