

Histochemical analysis reveals organ-specific quantitative trait loci for enzyme activities in Arabidopsis
- PMID: 14671010
- PMCID: PMC316303
- DOI: 10.1104/pp.103.027615
Histochemical analysis reveals organ-specific quantitative trait loci for enzyme activities in Arabidopsis
Abstract
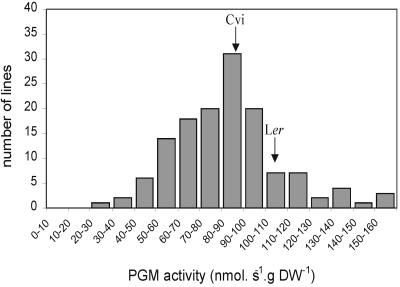
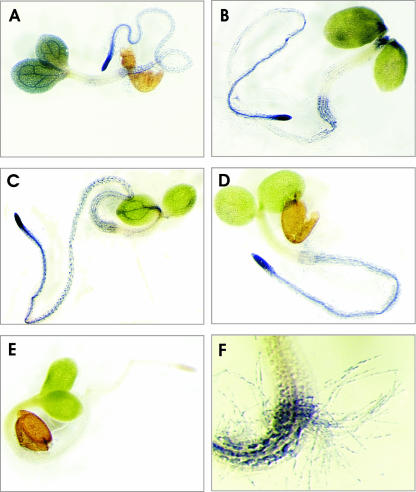
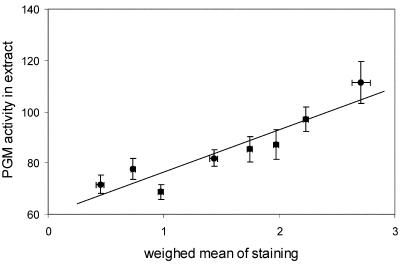
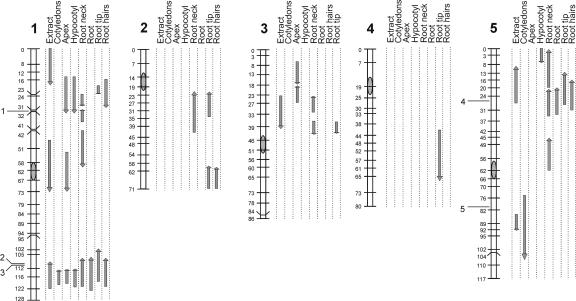
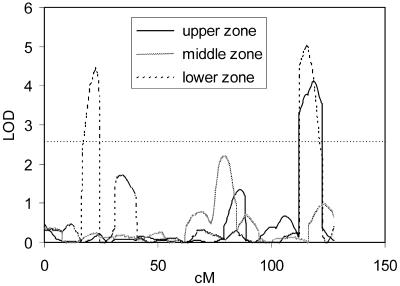
To identify genetic loci involved in the regulation of organ-specific enzyme activities, a specific histochemical staining protocol was used in combination with quantitative trait locus (QTL) analysis. Using phosphoglucomutase (PGM) as an example, it is shown that enzyme activity can specifically, and with high resolution, be visualized in non-sectioned seedlings of Arabidopsis. The intensities of staining were converted to quantitative data and used as trait for QTL analysis using Landsberg erecta x Cape Verde Islands recombinant inbred lines. Independently, PGM activities were quantified in whole-seedling extracts, and these data were also used for QTL analysis. On the basis of extract data, six significant (P < 0.05) loci affecting PGM activity were found. From the histochemical data, one or more specific QTLs were found for each organ analyzed (cotyledons, shoot apex, hypocotyl, root, root neck, root tip, and root hairs). Loci detected for PGM activity in extracts colocated with loci for histochemical staining. QTLs were found coinciding with positions of (putative) PGM genes but also at other positions, the latter ones supposedly pointing toward regulatory genes. Some of this type of loci were also organ specific. It is concluded that QTL analysis based on histochemical data is feasible and may reveal organ-specific loci involved in the regulation of metabolic pathways.
Figures
References
-
- Arabidopsis Genome Initiative (2000) Analysis of the gene sequence of the flowering plant Arabidopsis thaliana. Nature 408: 796-815 - PubMed
-
- Alonso-Blanco C, Peeters AJM, Koornneef M, Lister C, Dean C, van den Bosch N, Pot J, Kuiper MTR (1998) Development of an AFLP based linkage map of Ler, Col and Cvi Arabidopsis thaliana ecotypes and construction of a Ler/Cvi recombinant inbred line population. Plant J 14: 259-271 - PubMed
-
- Corbesier L, Lejeune P, Bernier G (1998) The role of carbohydrates in the induction of flowering in Arabidopsis thaliana: comparison between the wild type and a starchless mutant. Planta 206: 131-137 - PubMed
-
- Fernie AR, Swiedrych A, Tauberger E, Lytovchenko A, Trethewey RN, Willmitzer L (2002) Potato plants exhibiting combined antisense repression of cytosolic and plastidial isoforms of phosphoglucomutase surprisingly approximate wild type with respect to the rate of starch synthesis. Plant Physiol Biochem 40: 921-927
Publication types
MeSH terms
Substances
LinkOut - more resources
Full Text Sources
Molecular Biology Databases
Miscellaneous
