. 2004 Jan;16(1):215-28.
doi: 10.1105/tpc.017194. Epub 2003 Dec 11.

Interactions between plasma membrane aquaporins modulate their water channel activity

Affiliations

Interactions between plasma membrane aquaporins modulate their water channel activity

Karolina Fetter et al. Plant Cell. 2004 Jan.

Abstract

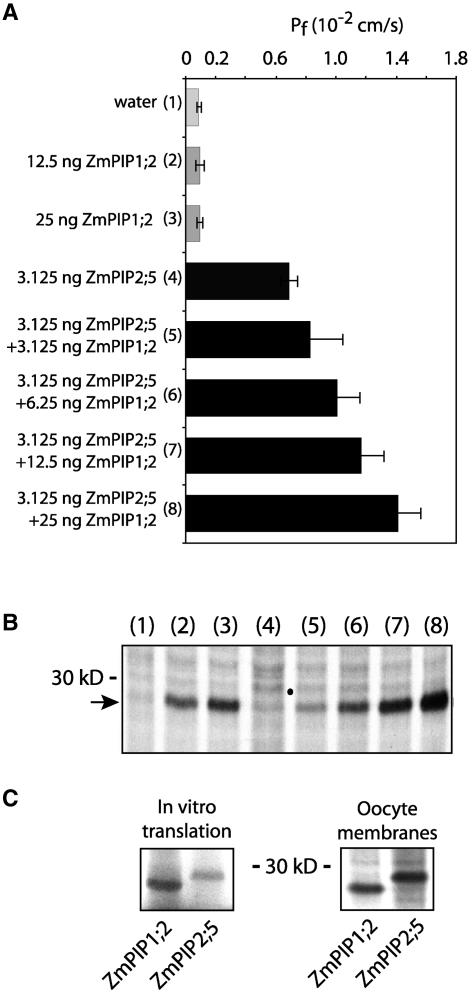
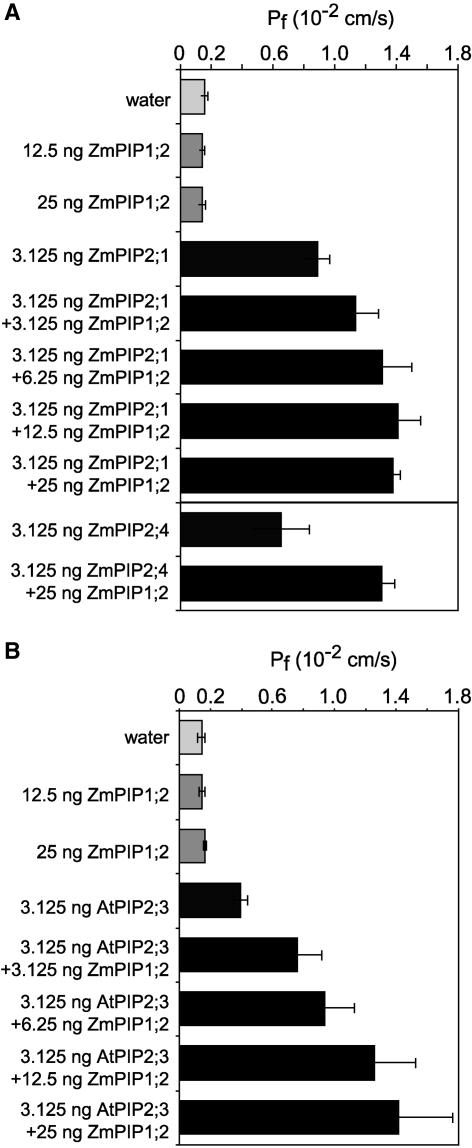
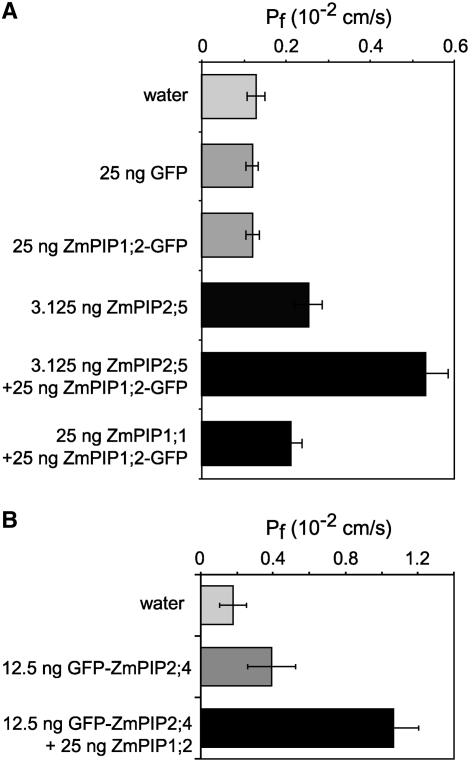
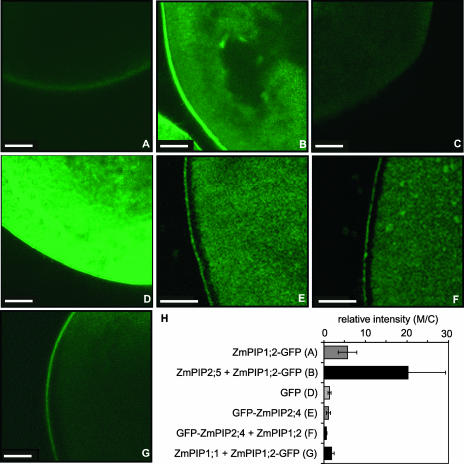
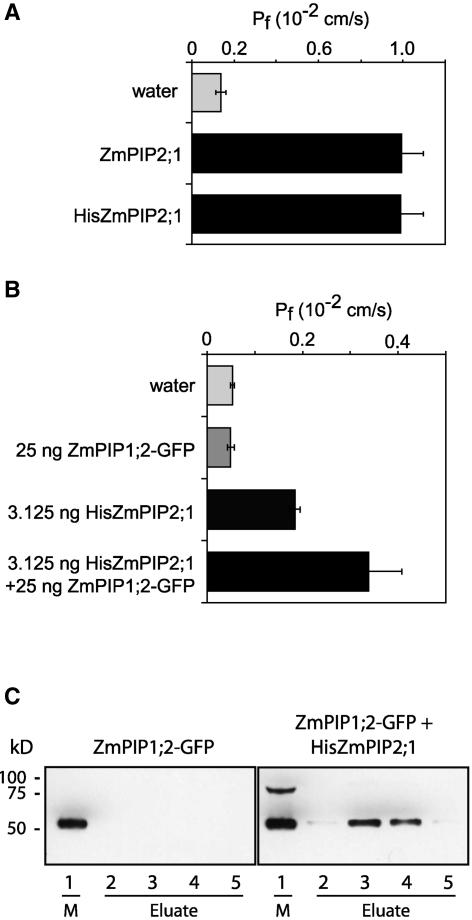
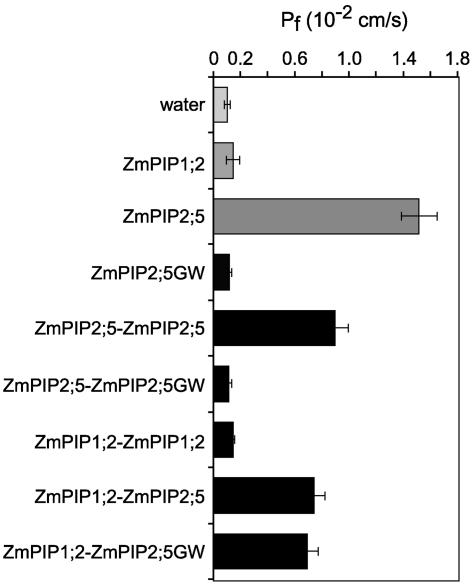
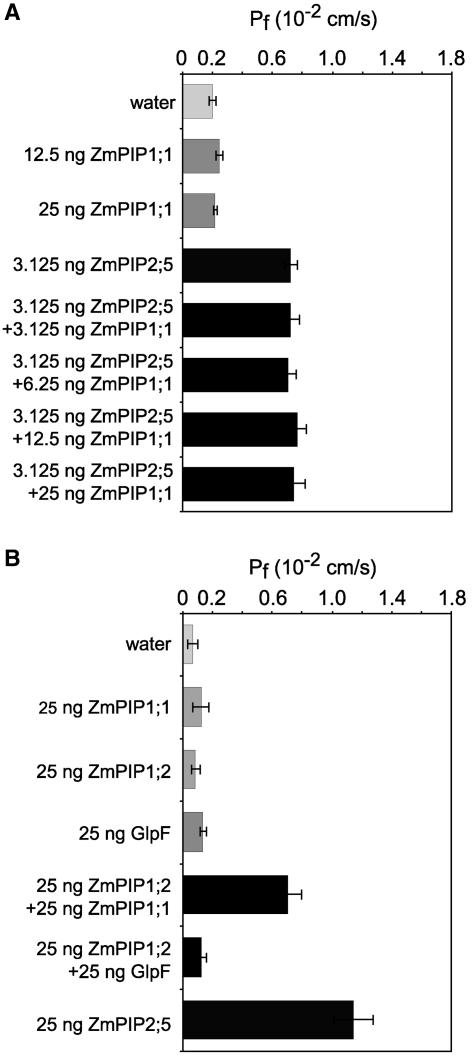
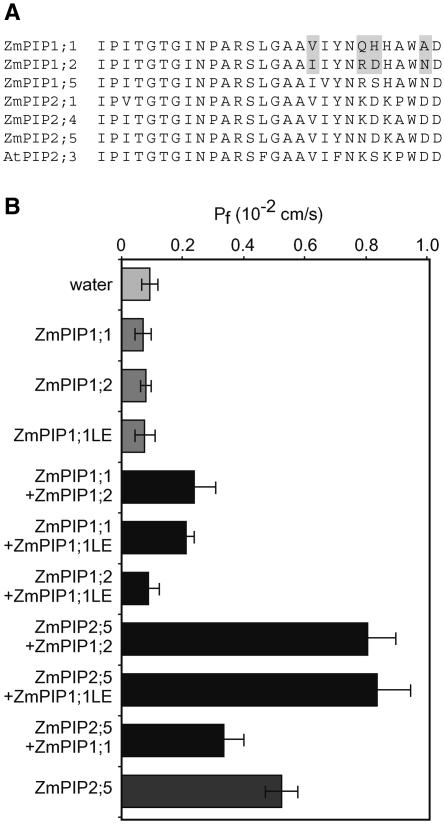
Plant plasma membrane intrinsic proteins (PIPs) cluster in two evolutionary subgroups, PIP1 and PIP2, with different aquaporin activities when expressed in Xenopus oocytes. Maize ZmPIP1;1 and ZmPIP1;2 do not increase the osmotic water permeability coefficient (Pf), whereas ZmPIP2;1, ZmPIP2;4, and ZmPIP2;5 do. Here, we show that coexpression of the nonfunctional ZmPIP1;2 and the functional ZmPIP2;1, ZmPIP2;4, or ZmPIP2;5 resulted in an increase in Pf that was dependent on the amount of injected ZmPIP1;2 complementary RNA. Confocal analysis of oocytes expressing ZmPIP1;2-green fluorescent protein (GFP) alone or ZmPIP1;2-GFP plus ZmPIP2;5 showed that the amount of ZmPIP1;2-GFP present in the plasma membrane was significantly greater in coexpressing cells. Nickel affinity chromatography purification of ZmPIP2;1 fused to a His tag coeluted with ZmPIP1;2-GFP demonstrated physical interaction and heteromerization of both isoforms. Interestingly, coexpression of ZmPIP1;1 and ZmPIP2;5 did not result in a greater increase in Pf than did the expression of ZmPIP2;5 alone, but coexpression of the ZmPIP1;1 and ZmPIP1;2 isoforms induced a Pf increase, indicating that PIP1 isoform heteromerization is required for both of them to act as functional water channels. Mutational analysis demonstrated the important role of the C-terminal part of loop E in PIP interaction and water channel activity induction. This study has revealed a new mechanism of plant aquaporin regulation that might be important in plant water relations.


Figures

Figure 1.
Figure 1.
Pf Values and Protein Labeling of Individual Xenopus Oocytes Expressing ZmPIP1;2 and ZmPIP2;5 Alone and in Combination. (A) Pf values of oocytes injected with water or ZmPIP1;2 and/or ZmPIP2;5 cRNA. The different amounts of ZmPIP1;2 cRNA injected are indicated at left. The results are expressed as means of measurements from four to nine cells. The bars represent 95% confidence intervals. The numbers in parentheses correspond to the lane numbers in (B). (B) In vivo labeled proteins in the total membrane fraction prepared from oocytes from the same microinjection shown in (A). The band with an apparent molecular mass of ∼28 kD in lanes 2, 3, and 5 to 8 corresponds to ZmPIP1;2. ZmPIP2;5 (dot in lanes 4 to 8) is barely visible because of the very low amount of cRNA injected. A total of 100,000 cpm was loaded per lane, and the dried gel was exposed for 1 day at −70°C. The position of a 30-kD molecular weight mass is indicated. (C) Labeled ZmPIP1;2 and ZmPIP2;5 synthesized in vitro in rabbit reticulocyte lysate or in vivo in oocytes injected with 25 ng of cRNA.
Figure 2.
Figure 2.
Pf Values of Oocytes Coexpressing ZmPIP1;2 and ZmPIP2;1, ZmPIP2;4, or AtPIP2;3. (A) Pf values for oocytes injected with water or ZmPIP1;2 and/or either ZmPIP2;1 or ZmPIP2;4 cRNAs. The amounts of ZmPIP1;2, ZmPIP2;1, and ZmPIP2;4 cRNAs used are indicated at left. The results are expressed as means of measurements from 5 to 20 cells. The bars represent 95% confidence intervals. (B) Pf values for oocytes injected with water or ZmPIP1;2 and/or AtPIP2;3 cRNAs. The amounts of ZmPIP1;2 and AtPIP2;3 cRNAs used are indicated at left. The results are expressed as means of measurements from five to nine cells. The bars represent 95% confidence intervals.
Figure 3.
Figure 3.
Pf Values of Oocytes Coexpressing Different Combinations of GFP-Tagged ZmPIP1;2 or ZmPIP2;4 and Either Active ZmPIP2;5, ZmPIP1;2, or ZmPIP1;1. (A) Pf values for oocytes injected with ZmPIP1;2-GFP and ZmPIP2;5 or ZmPIP1;1 cRNAs. The amounts of cRNA used are indicated at left. The results are expressed as means of measurements from 6 to 12 cells. The bars represent 95% confidence intervals. (B) Pf values for oocytes injected with GFP-ZmPIP2;4 and ZmPIP1;2 cRNAs. The amounts of cRNA used are indicated at left. The results are expressed as means of measurements from six to eight cells. The bars represent 95% confidence intervals.
Figure 4.
Figure 4.
Confocal Microscopic Images of Oocytes Showing the Localization of ZmPIP1;2-GFP or GFP-ZmPIP2;4. (A) Oocyte injected with 25 ng of ZmPIP1;2-GFP cRNA. (B) Oocyte injected with 25 ng of ZmPIP1;2-GFP and 3.125 ng of ZmPIP2;5 cRNAs. (C) Oocyte injected with water. (D) Oocyte injected with 25 ng of GFP cRNA. (E) Oocyte injected with 12.5 ng of GFP-ZmPIP2;4 cRNA. (F) Oocyte injected with 12.5 ng of GFP-ZmPIP2;4 and 25 ng of ZmPIP1;2 cRNAs. (G) Oocyte injected with 25 ng of ZmPIP1;2-GFP and 25 ng of ZmPIP1;1 cRNAs. The oocytes were observed 3 days after injection as described in Methods. Bars = 100 μm. (H) Relative fluorescence signal intensity in the membrane (M) compared with the cytosol (C) measured with the ImageJ program. The results are expressed as means from four to seven oocytes. The bars represent 95% confidence intervals.
Figure 5.
Figure 5.
Pf Values of Oocytes Expressing ZmPIP2;1, His-ZmPIP2;1, ZmPIP1;2-GFP, or Combinations of These and Copurification of ZmPIP1;2-GFP with His-ZmPIP2;1. (A) Pf values of oocytes injected with water or 50 ng of cRNA encoding ZmPIP2;1 and His-ZmPIP2;1. The results are expressed as means of measurements from 9 to 16 cells. The bars represent 95% confidence intervals. (B) Pf values of oocytes injected with water or cRNA encoding ZmPIP1;2-GFP, His-PIP2;1, or a combination of these. The results are expressed as means of measurements from 6 to 16 cells. The bars represent 95% confidence intervals. (C) Immunodetection of ZmPIP1;2-GFP in oocyte crude membrane (M; lane 1) or in eluted fractions (lanes 2 to 5) obtained after protein purification on a nickel column. The left and right gels show fractions obtained from oocytes expressing ZmPIP1;2-GFP alone or coexpressing ZmPIP1;2-GFP and His-ZmPIP2;1, respectively. The positions of molecular mass markers are indicated at left.
Figure 6.
Figure 6.
Pf Values and Protein Labeling of Xenopus Oocytes Expressing Single Polypeptide Chain Dimeric ZmPIP Proteins. Pf values for oocytes injected with 50 ng of cRNA encoding ZmPIP2;5 monomers or chimeric dimers as indicated at left. The results are expressed as means of measurements from 9 to 17 cells. The bars represent 95% confidence intervals.
Figure 7.
Figure 7.
Pf Values of Oocytes Coexpressing ZmPIP1;1 and ZmPIP2;5, ZmPIP1;2, or GlpF. (A) Pf values of oocytes injected with water or ZmPIP1;1 and/or ZmPIP2;5 cRNAs. The amounts of ZmPIP1;1 cRNA injected are indicated at left. The results are expressed as means of measurements from 7 to 17 cells. The bars represent 95% confidence intervals. (B) Pf values of oocytes injected with water or ZmPIP1;1, ZmPIP1;2, or ZmPIP1;2 plus either ZmPIP1;1 or GlpF cRNAs. The amounts of cRNAs injected are indicated at left. The results are expressed as means of measurements from 8 to 11 cells. The bars represent 95% confidence intervals.
Figure 8.
Figure 8.
Sequence Comparison of Loop E, and Pf Values for Oocytes Coexpressing Various Combinations of ZmPIP1;1LE, ZmPIP1;1, ZmPIP1;2, and ZmPIP2;5. (A) Loop E sequences from ZmPIP1;1, ZmPIP1;2, ZmPIP1;5, ZmPIP2;1, ZmPIP2;4, ZmPIP2;5, and AtPIP2;3. Amino acid residues that differ between ZmPIP1;1 and ZmPIP1;2 are indicated by gray boxes. (B) Pf values of oocytes expressing ZmPIP1;1, ZmPIP1;1LE, ZmPIP1;2, or ZmPIP2;5 and combinations of these. The amounts of cRNAs injected were 3.125 ng for ZmPIP2;5 and 25 ng for the other ZmPIP1 cRNAs. The results are expressed as means of measurements from 4 to 10 cells. The bars represent 95% confidence intervals.
Figure 9.
Figure 9.
Expression of ZmPIPs in Maize Roots. (A) to (F) Localization of ZmPIP2;5 ([A], [B], and [E]) and ZmPIP1;2 ([C] and [F]) mRNA by in situ RT-PCR on the maize root tip. Longitudinal sections ([A] to [C]) and cross-sections ([D] to [F]) are shown. (D) shows a control section for DNase treatment efficiency using the same conditions except that no reverse transcriptase was added. Arrows indicate expression in the parenchyma cells of the late xylem vessels. Arrowheads in the inset in (A) indicate expression in the cytoplasm. Bars = 100 μm. (G) and (H) A maize root before (G) and after (H) shaving the root hair. (I) RT-PCR analysis of the expression of ZmPIP1;1, ZmPIP1;2, ZmPIP1;5, ZmPIP2;1, ZmPIP2;4, and ZmPIP2;5 in the root hair. M, molecular mass markers; rh, root hair; wr, whole root.

Similar articles

Cited by

References

    1. Barone, L.M., Mu, H.H., Shih, C.J., Kashlan, K.B., and Wasserman, B.P. (1998). Distinct biochemical and topological properties of the 31- and 27-kilodalton plasma membrane intrinsic protein subgroups from red beet. Plant Physiol. 118, 315–322. - PMC - PubMed
    1. Barrieu, F., Chaumont, F., and Chrispeels, M.J. (1998). High expression of the tonoplast aquaporin ZmTIP1 in epidermal and conducting tissues of maize. Plant Physiol. 117, 1153–1163. - PMC - PubMed
    1. Batoko, H., Zheng, H.Q., Hawes, C., and Moore, I. (2000). A Rab1 GTPase is required for transport between the endoplasmic reticulum and Golgi apparatus and for normal Golgi movement in plants. Plant Cell 12, 2201–2217. - PMC - PubMed
    1. Biela, A., Grote, K., Otto, B., Hoth, S., Hedrich, R., and Kaldenhoff, R. (1999). The Nicotiana tabacum plasma membrane aquaporin NtAQP1 is mercury-insensitive and permeable for glycerol. Plant J. 18, 565–570. - PubMed
    1. Chaumont, F., Barrieu, F., Jung, R., and Chrispeels, M.J. (2000. a). Plasma membrane intrinsic proteins from maize cluster in two sequence subgroups with differential aquaporin activity. Plant Physiol. 122, 1025–1034. - PMC - PubMed

Publication types

MeSH terms

LinkOut - more resources