. 2004 Jan;16(1):74-87.
doi: 10.1105/tpc.017962. Epub 2003 Dec 11.

In vivo analysis of cell division, cell growth, and differentiation at the shoot apical meristem in Arabidopsis

Affiliations

In vivo analysis of cell division, cell growth, and differentiation at the shoot apical meristem in Arabidopsis

Olivier Grandjean et al. Plant Cell. 2004 Jan.

Abstract

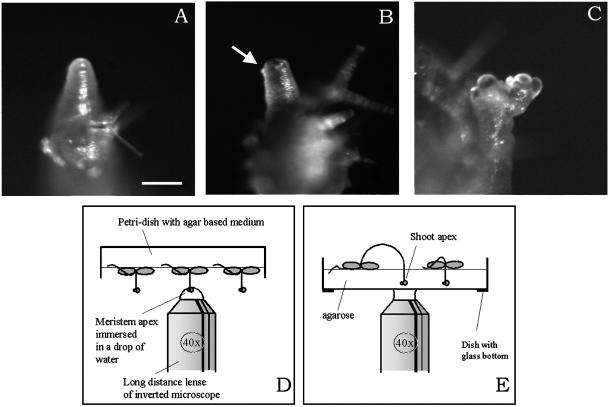
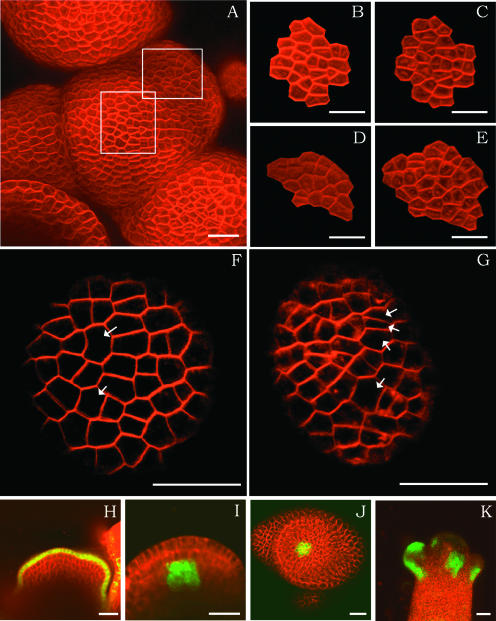
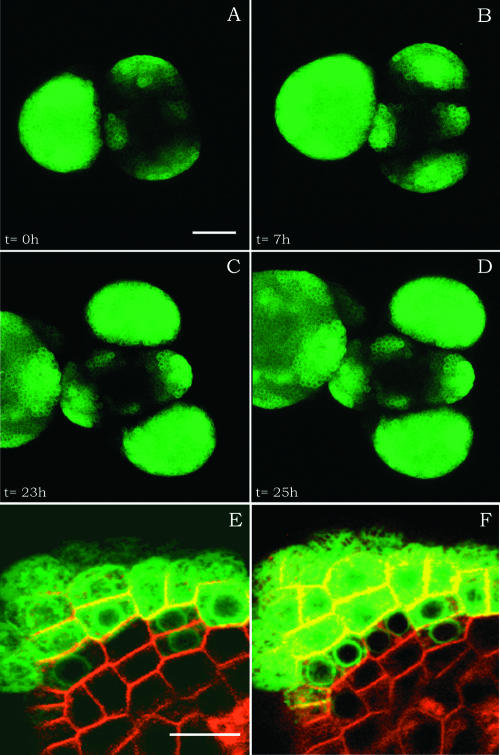
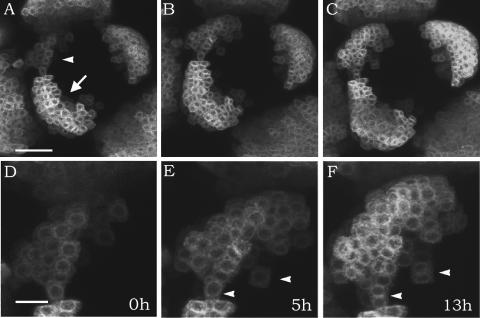
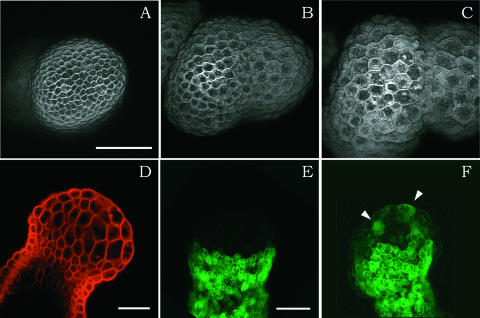
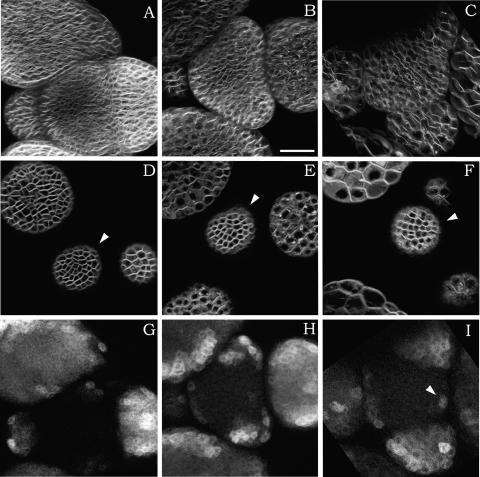
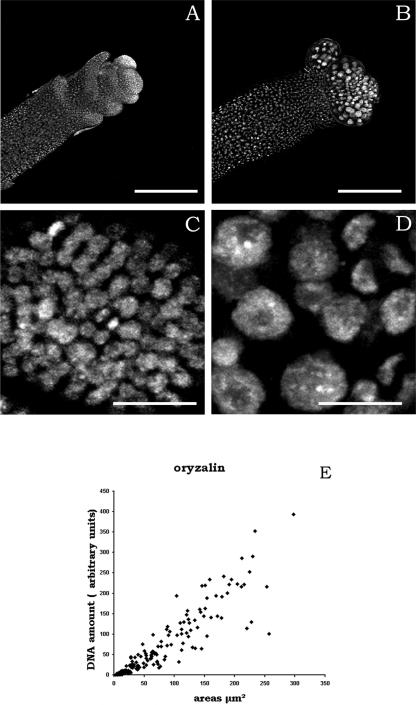
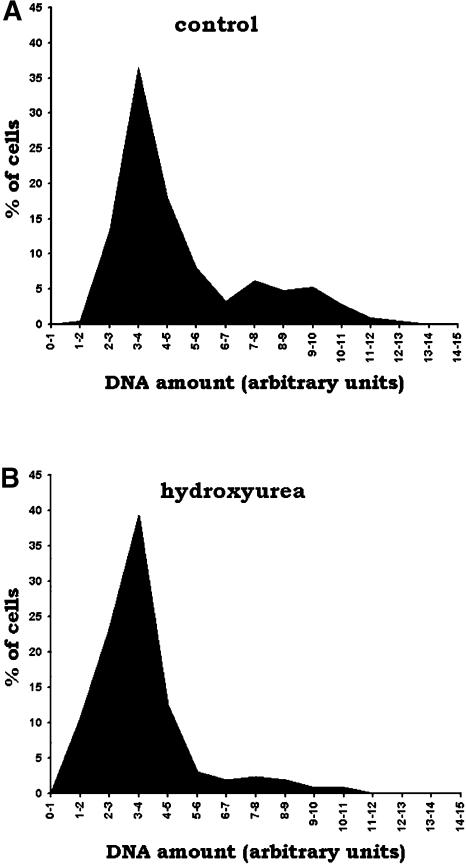
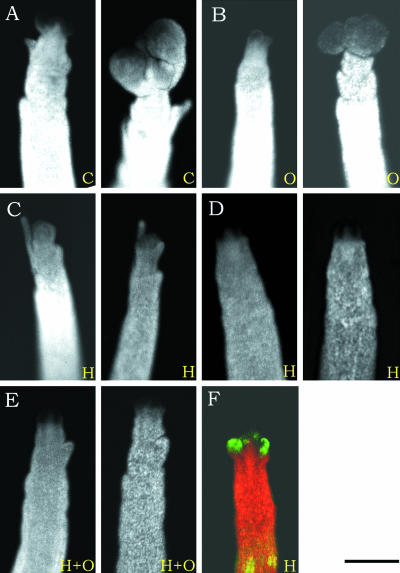
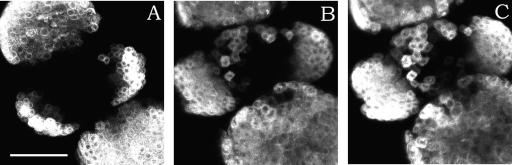
The aerial parts of the plant are generated by groups of rapidly dividing cells called shoot apical meristems. To analyze cell behavior in these structures, we developed a technique to visualize living shoot apical meristems using the confocal microscope. This method, combined with green fluorescent protein marker lines and vital stains, allows us to follow the dynamics of cell proliferation, cell expansion, and cell differentiation at the shoot apex. Using this approach, the effects of several mitotic drugs on meristem development were studied. Oryzalin (depolymerizing microtubules) very rapidly caused cell division arrest. Nevertheless, both cell expansion and cell differentiation proceeded in the treated meristems. Interestingly, DNA synthesis was not blocked, and the meristematic cells went through several rounds of endoreduplication in the presence of the drug. We next treated the meristems with two inhibitors of DNA synthesis, aphidicolin and hydroxyurea. In this case, cell growth and, later, cell differentiation were inhibited, suggesting an important role for DNA synthesis in growth and patterning.


Figures

Figure 1.
Figure 1.
Presentation of the Methods Used to Observe Living Meristems. (A) to (C) Examples of regenerating meristems at 0 h (A), 48 h (B), and 96 h (C) after NPA treatment. The arrow in (B) points to a very young primordium. Bar = 100 μm. (D) and (E) Diagrams of the experimental setup. Meristems of plants growing on normal medium can be immersed directly in a drop of water on a long-distance lens (D). Alternatively, the tips of the meristems can be immobilized in a thin layer of agarose in a dish with a glass bottom (E).
Figure 2.
Figure 2.
Cell Behavior and Meristem Organization. (A) An inflorescence apex showing a meristem and young primordia stained with FM 4-64. The meristem was followed for 31 h. (B) and (C) Magnifications of the central part of the meristem shown in (A) (central square). Micrographs were taken at an interval of 31 h. (D) and (E) Magnification of a group of cells forming a primordium (peripheral square in [A]). Cells at the periphery divide more quickly than cells in the center (same interval of 31 h). (F) and (G) Detail of a floral primordium of another plant taken at an interval of 24 h. Note that certain cells (arrows) have divided twice, whereas others have not divided at all, showing the heterogeneous duration of the cell cycle. (H) to (K) Expression patterns of the ATML1 promoter (H), the WUS promoter (longitudinal section [I] and transverse section [J]), and the ANT promoter (K) all driving GFP. Bars = 20 μm.
Figure 3.
Figure 3.
Phyllotaxis and Cell Differentiation. (A) to (D) Z projections of the same meristem expressing ANT:GFP at 24 to 49 h after NPA treatment. During this period, two new primordia were initiated. Phyllotaxis is comparable to that in the wild type. Bar = 40 μm. (E) and (F) Details of another meristem expressing ANT:GFP and counterstained with FM 4-64. Cell differentiation and division can be monitored. Bar = 10 μm.
Figure 4.
Figure 4.
Cell Recruitment During Organ Initiation. (A) to (C) Primordium initiation in a meristem expressing GFP under the control of LFY:ALCR. The primordium indicated with an arrowhead was still recruiting cells, whereas the primordium indicated with an arrow was only growing by cell proliferation. Bar = 30 mm. (D) to (F) Details of the initiating primordium shown in (A) to (C). During the 5 h between (D) and (E), new cells were added to the primordium. In the 8 h between (E) and (F), the primordium only grew by cell proliferation. Arrowheads point to cells that have divided. Bar = 10 μm.
Figure 5.
Figure 5.
Oryzalin Treatment of Meristems That Have Not Yet Formed Primordia. (A) to (C) Three images (three-dimensional reconstructions with the Power 3D software by Leica from serial optical sections) of the same meristem in the presence of oryzalin at the same magnification and after staining with FM 4-64 after 2 h (A), 26 h (B), and 44 h (C) of treatment. The cells do not divide but continue to grow. At the beginning of the treatment, the meristem had not yet formed any primordia. In presence of the drug, several bulges form. Bar = 50 μm. (D) Longitudinal cross-section of another meristem treated with oryzalin after staining. Note that only the cells at the apex are swollen (i.e., the cells that were growing rapidly at the moment of drug treatment). The others do not appear to be affected. Bar = 50 mm. (E) and (F) ANT:GFP activity in the same meristem treated with oryzalin for 1 h (E) and 24 h (F). New cells activate GFP (arrowheads), but no discrete primordia are formed. Bar = 50 μm.
Figure 6.
Figure 6.
Cell Expansion and Cell Differentiation in a Meristem Treated with Oryzalin Followed for 49 h. (A) to (C) Z projections of serial sections to give an overall view (FM 4-64 staining). Cells at the periphery of the meristem clearly expand at a much faster rate than cells at the meristem center. Interval between (A) and (B), 15 h; interval between (A) and (C), 49 h. (D) to (F) Single sections of the same meristem, again showing the difference in cell expansion between the meristem center and the periphery. The meristem center is indicated with the arrowheads. (G) to (I) Z projections of serial sections of the same meristem, this time showing ANT:GFP labeling. New cells continue to activate the ANT promoter, even after several days in the presence of oryzalin. New groups of ANT-positive cells are generated approximately at the correct position, although the pattern is somewhat perturbed (e.g., only a single cell expresses GFP in [I], as indicated by the arrowhead). Bar in (B) = 40 μm.
Figure 7.
Figure 7.
Nuclear Size and Oryzalin Treatments. (A) and (B) Low magnifications of the apices of control (A) and oryzalin-treated (B) plants. Bars = 200 μm. (C) and (D) Higher magnifications showing the difference in nuclear size of the control (C) and oryzalin-treated (D) meristematic cells. Bars = 20 μm. (E) Quantification of the relative amount of DNA and the size (expressed as the surface of the median section) of nuclei in oryzalin-treated meristems (diamonds). Control nuclei fell within the range of 0 to 13 units and are not shown. Many of the oryzalin-treated nuclei show a huge amplification of the DNA, the amount of DNA per nucleus being approximately proportional to the nuclear size (212 nuclei, three meristems).
Figure 8.
Figure 8.
Quantification of DNA Using Image Analysis of Cells Stained with 4′,6-Diamidino-2-Phenylindole. DNA amount is expressed in arbitrary units, as in Figure 7E. (A) Quantification of the relative amount of DNA in nuclei from control plants. Two peaks are observed, which correspond to G1 and S/G2 cells (211 cells, four meristems). (B) Quantification of the relative amount of DNA after HU treatment (262 cells, three meristems). Besides the major peak corresponding to G1 cells, only a small proportion of cells fall outside this peak, likely corresponding to cells blocked in S-phase. No M-phase cells are observed in these cell populations.
Figure 9.
Figure 9.
Macroscopic Views of HU- and Oryzalin-Treated Apices. (A) to (E) Macroscopic views of control apices (C) and apices treated with oryzalin (O), HU (H), and HU plus oryzalin (H+O). Micrographs were taken at 0 and 72 h after the start of treatment. (F) Apex of a meristem expressing LFY:ALCR, which was first treated with HU for 72 h. Subsequently, ALCA:GFP was induced using ethanol vapors. This micrograph shows that in the presence of HU, transcription and translation are not inhibited.
Figure 10.
Figure 10.
Effects of HU on Cell Expansion and Cell Differentiation. Overview of a meristem expressing GFP under the control of LFY:ALCR after 7 h (A), 32 h (B), and 53 h (C) of treatment with HU (40 mM). Note that cell differentiation continues, although only one new zone expressing GFP is activated. Growth also is very limited (cf. Figure 4). Bar = 40 μm.

References

    1. Ambros, V. (1999). Cell-cycle dependent sequencing of cell fate decisions in Caenorhabditis elegans vulva precursor cells. Development 126, 1947–1956. - PubMed
    1. Blazquez, M.A., Soowal, L.N., Lee, I., and Weigel, D. (1997). LEAFY expression and flower initiation in Arabidopsis. Development 124, 3835–3844. - PubMed
    1. Blilou, I., Frugier, F., Folmer, S., Serralbo, O., Willemsen, V., Wolkenfelt, H., Eloy, N., Ferreira, P.C.G., Weisbeek, P., and Scheres, B. (2002). The Arabidopsis HOBBIT gene encodes a CDC27 homolog that links the plant cell cycle to progression of cell differentiation. Genes Dev. 16, 2566–2575. - PMC - PubMed
    1. Boisnard-Lorig, C., Colon-Carmona, A., Bauch, M., Hodge, S., Doerner, P., Bancharel, E., Dumas, C., Haseloff, J., and Berger, F. (2001). Dynamic analyses of the expression of the HISTONE:YFP fusion protein in Arabidopsis show that syncytial endosperm is divided in mitotic domains. Plant Cell 13, 495–509. - PMC - PubMed
    1. Bossinger, G., and Smyth, D.R. (1996). Initiation patterns of flower and floral organ development in Arabidopsis thaliana. Development 122, 1093–1102. - PubMed

Publication types

MeSH terms