. 2003 Dec 23;100(26):15601-6.
doi: 10.1073/pnas.2636900100. Epub 2003 Dec 11.

Mullerian Inhibiting Substance inhibits cervical cancer cell growth via a pathway involving p130 and p107

Affiliations

Mullerian Inhibiting Substance inhibits cervical cancer cell growth via a pathway involving p130 and p107

Thanh U Barbie et al. Proc Natl Acad Sci U S A. .

Abstract

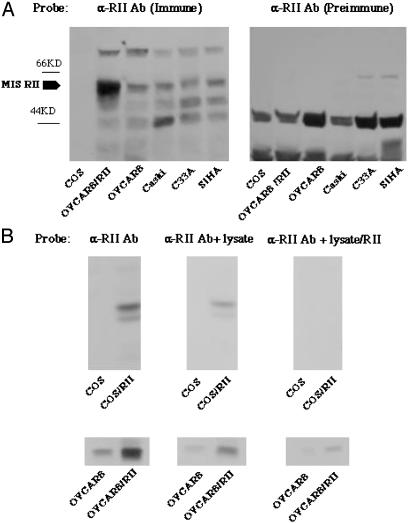
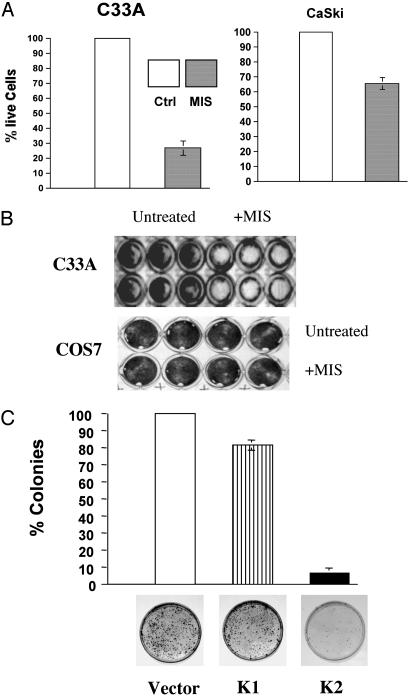
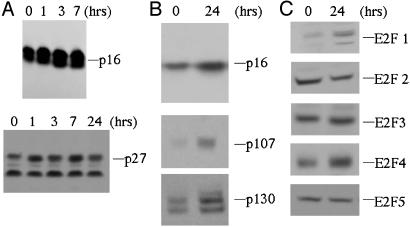
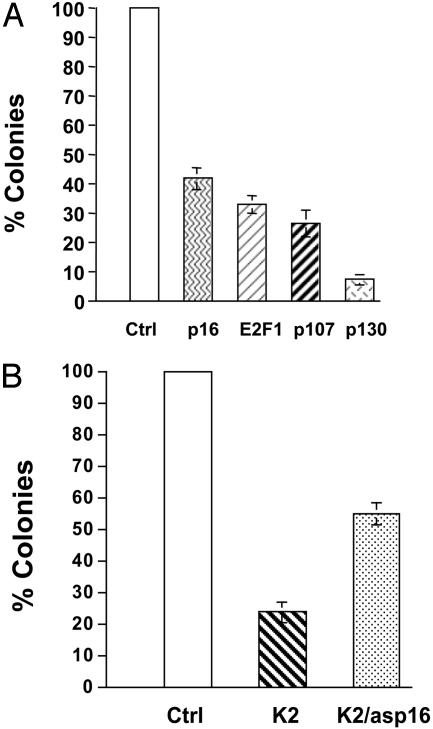
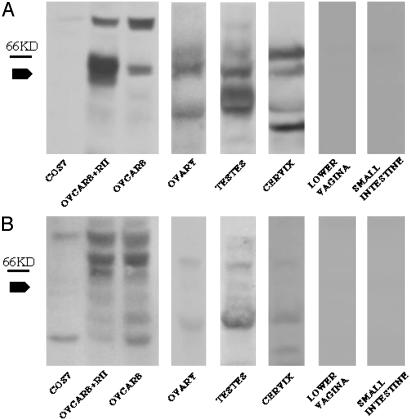
In addition to causing regression of the Mullerian duct in the male embryo, Mullerian Inhibiting Substance (MIS) inhibits the growth of epithelial ovarian cancer cells, which are known to be of Mullerian origin. Because the uterine cervix is derived from the same Mullerian duct precursor as the epithelium of the ovary, we tested the hypothesis that cervical cancer cells might also respond to MIS. A number of cervical cancer cell lines express the MIS type II receptor, and MIS inhibits the growth of both human papilloma virus-transformed and non-human papilloma virus-transformed cervical cell lines, with a more dramatic effect seen in the latter. As in the ovarian cancer cell line OVCAR8, suppression of growth of the C33A cervical cancer cell line by MIS is associated with induction of the p16 tumor suppressor protein. However, in contrast to OVCAR8 cells, induction of p130 and p107 appears to play an important role in the inhibition of growth of C33A cells by MIS. Finally, normal cervical tissue expresses the MIS type II receptor in vivo, supporting the idea that MIS could be a targeted therapy for cervical cancer.


Figures

Fig. 1.
Fig. 1.
Cervical cancer cell lines express the MIS type II receptor [α-RII Ab (immune)]. (A) Cell lysates prepared from COS cells, OVCAR8 cells, and the cervical cell lines Caski, C33A, and SiHa were probed with Ab against the MIS type II receptor. The 63-kDa receptor is present in all three cervical cell lines (lanes 4–6), as well as in WT OVCAR8 cells (lane 3). Overexpression of the receptor in OVCAR8 cells results in enhancement of this band (lane 2), and this band is absent in COS cells, which were used as a negative control (lane 1). Analogous lanes probed with preimmune serum do not show receptor [α-RII Ab (preimmune)]. (B) Cell lysates were prepared from untransfected COS cells and COS cells transfected with the MIS type II receptor (Upper), as well as untransfected OVCAR8 cells and OVCAR8 cells transfected with MIS RII (Lower). Blots probed MIS RII Ab alone recognize the 63-kDa receptor (lanes 1 and 2). Similar results are seen when the Ab is preincubated with COS lysate (lanes 3 and 4). In contrast, receptor recognition is significantly reduced when Ab is preincubated with lysate from COS cells expressing the MIS type II receptor, reflecting its retention in the lysate and confirming Ab specificity (lanes 5 and 6).
Fig. 2.
Fig. 2.
Inhibition of cervical cancer cell growth by MIS. (A) The MTT assay was used to quantify cell growth in response to treatment with MIS. C33A cells treated with MIS exhibit a 70–80% decline in cell number after 4 d compared to untreated controls, whereas CaSki cells exhibit 30–40% inhibition of cell growth after MIS treatment. All P values are statistically significant (<0.001). (B) Representative wells containing C33A cells and COS7 cells analyzed by the MTT assay after treatment with MIS. (C) C33A cells were stably transfected with empty vector, the leaderless inactive form of MIS (K1), and active MIS (K2). Minimal reduction in colony number is seen after transfection with inactive MIS, compared to 90–95% inhibition of colony growth in cells transfected with active MIS.
Fig. 3.
Fig. 3.
Induction of cell cycle proteins in response to MIS treatment. (A) C33A cells were harvested after treatment with MIS for various lengths of time. Induction of p16 is seen after only several hours of treatment, in contrast to p27, the levels of which remain constant. (B) Levels of p16 remain elevated after 24 h of MIS treatment. In addition, the pRB-related proteins p107 and p130 are induced after treatment of C33A cells with MIS for 24 h. (C) Examination of E2F family members in MIS-treated C33A cells reveals that E2Fs 1 and 4 are induced after 24 h of treatment, whereas the levels of E2Fs 2, 3 and 5 remain constant. All experiments were performed in duplicate or triplicate, and representative blots are shown.
Fig. 4.
Fig. 4.
Effects of cell cycle protein expression on C33A cell growth. (A) C33A cells were stably transfected with empty vector, p16, E2F1, p107, or p130, and results are presented from three separate experiments. Overexpression of p16 results in a moderate suppression of colony growth, comparable to that seen after transfection with E2F1 or p107. In contrast, a greater degree of growth inhibition is observed when p130 is overexpressed in C33A cells. All results are statistically significant. (B) C33A cells were stably transfected with empty vector (Ctrl), active MIS (K2), or K2 and antisense p16 (K2/asp16). Expression of MIS results in a significant inhibition of colony growth, which is partially rescued by antisense p16. Results are presented from three separate experiments and are statistically significant.
Fig. 5.
Fig. 5.
The MIS type II receptor is expressed in normal rat cervical tissue. (A) Lysates prepared from rat ovary, testes, cervix, lower vagina, and small intestine were probed with Ab against the MIS type II receptor. The 63-kDa receptor is present in OVCAR8 cells at endogenous levels and overexpressed in OVCAR8 cells transfected with the MIS type II receptor construct. Analogous bands are present in rat ovarian, testicular, and cervical tissue but not in the tissue prepared from the non-Mullerian tissues from the lower vagina or small intestine. (B) The 63-kDa receptor band is not seen when the blot is probed with preimmune serum, confirming specificity of the Ab.

References

    1. Donahoe, P. K., Swann, D. A., Hayashi, A. & Sullivan, M. D. (1979) Science 205, 913–915. - PubMed
    1. Fuller, A. F., Jr., Guy, S., Budzik, G. P. & Donahoe, P. K. (1982) J. Clin. Endocrinol. Metab. 54, 1051–1055. - PubMed
    1. Donahoe, P. K., Fuller, A. F., Jr., Scully, R. E., Guy, S. R. & Budzik, G. P. (1981) Ann. Surg. 194, 472–480. - PMC - PubMed
    1. Fuller, A. F., Jr., Budzik, G. P., Krane, I. M. & Donahoe, P. K. (1984) Gynecol. Oncol. 17, 124–132. - PubMed
    1. Masiakos, P. T., MacLaughlin, D. T., Maheswaran, S., Teixeira, J., Fuller, A. F., Jr., Shah, P. C., Kehas, D. J., Kenneally, M. K., Dombkowski, D. M., Ha, T. U., et al. (1999) Clin. Cancer Res. 5, 3488–3499. - PubMed

Publication types

MeSH terms