Comparative Study
. 2004 Jan;14(1):99-108.
doi: 10.1101/gr.1739204. Epub 2003 Dec 12.

Whole-genome discovery of transcription factor binding sites by network-level conservation

Affiliations
Comparative Study

Whole-genome discovery of transcription factor binding sites by network-level conservation

Moshe Pritsker et al. Genome Res. 2004 Jan.

Abstract

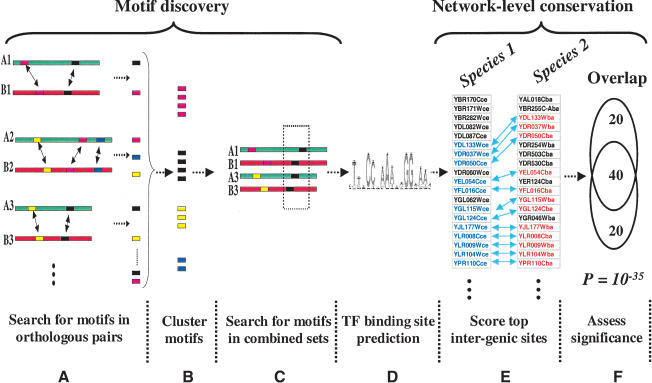
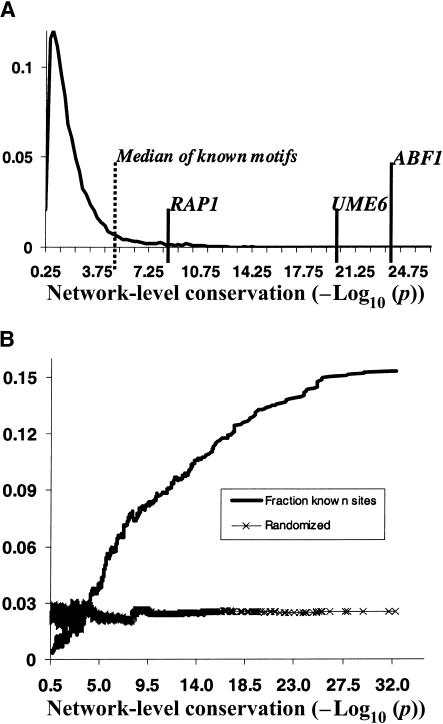
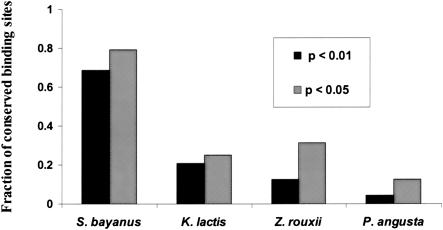
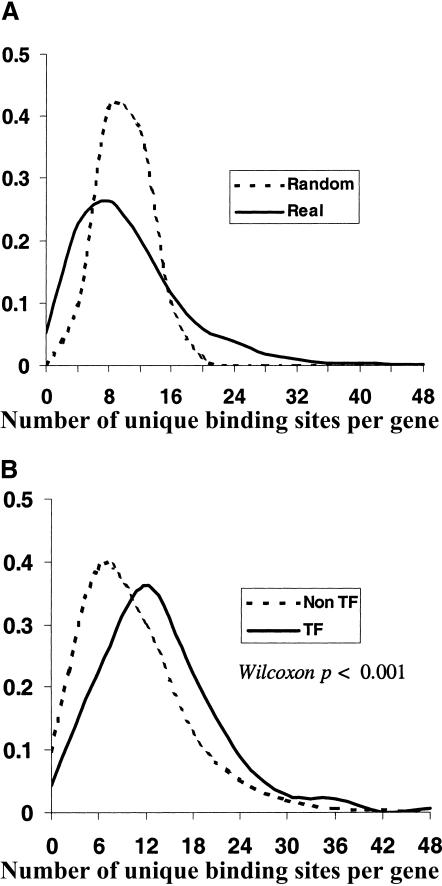
Comprehensive identification of DNA cis-regulatory elements is crucial for a predictive understanding of transcriptional network dynamics. Strong evidence suggests that these DNA sequence motifs are highly conserved between related species, reflecting strong selection on the network of regulatory interactions that underlie common cellular behavior. Here, we exploit a systems-level aspect of this conservation-the network-level topology of these interactions-to map transcription factor (TF) binding sites on a genomic scale. Using network-level conservation as a constraint, our algorithm finds 71% of known TF binding sites in the yeast Saccharomyces cerevisiae, using only 12% of the sequence of a phylogenetic neighbor. Most of the novel predicted motifs show strong features of known TF binding sites, such as functional category and/or expression profile coherence of their corresponding genes. Network-level conservation should provide a powerful constraint for the systematic mapping of TF binding sites in the larger genomes of higher eukaryotes.


Figures

Figure 1
Figure 1
Schematic representation of the algorithm. (A) Upstream sequences from orthologous pairs of genes are searched to identify motifs using Gibbs-sampling. (B) Motif predictions are pooled and clustered by similarity. (C) The pairs of upstream sequences which yielded similar motifs (within a motif cluster) are combined and searched again for motifs using a second round of Gibbs-sampling. (D) A large number of motif predictions which need to be pruned. (E) To test for network-level conservation, the genes containing the top intergenic (5′ upstream) matches to each motif are identified in the two species. (F) The statistical significance of overlap between the two sets of genes is determined using the hypergeometric distribution.
Figure 2
Figure 2
Most significantly conserved motifs are highly enriched in known TF binding sites. (A) The distribution of network-level conservation significance (-Log10(p)) for a set of 10,000 random motifs. The median value for the 48 known TF binding sites is 4.5 (vertical dashed line). A representative set of conserved known TF binding sites is highlighted on the tail of the distribution. (B) The fraction of strong matches to known TF binding sites in a 2000 wide sliding window across the entire P-value distribution of all the 80,000 secondary motifs.
Figure 3
Figure 3
Evolutionary conservation of motif attributes. (A) Distribution of normalized RMS-deviation of motif scores for all 80,000 secondary motifs (dashed line) compared to the top motif predictions (network-level conservation P-value < 10-10; solid line). (B) Distribution of RMS-deviation in spatial position upstream of translational start for all the motifs (dashed line) compared to the most highly conserved (P < 10-10; solid line). (C) Distribution of P-values (binomial) for conservation of motif orientation for all of the 80,000 secondary motif predictions (dashed line), compared to the most highly conserved (P < 10-10; solid line). Vertical dashed line is the median value for strong matches to the 48 known TF binding sites.
Figure 3
Figure 3
Evolutionary conservation of motif attributes. (A) Distribution of normalized RMS-deviation of motif scores for all 80,000 secondary motifs (dashed line) compared to the top motif predictions (network-level conservation P-value < 10-10; solid line). (B) Distribution of RMS-deviation in spatial position upstream of translational start for all the motifs (dashed line) compared to the most highly conserved (P < 10-10; solid line). (C) Distribution of P-values (binomial) for conservation of motif orientation for all of the 80,000 secondary motif predictions (dashed line), compared to the most highly conserved (P < 10-10; solid line). Vertical dashed line is the median value for strong matches to the 48 known TF binding sites.
Figure 4
Figure 4
Conservation of 48 known S. cerevisiae binding sites across four yeast species. Fraction of conserved binding sites at network-level conservation; P-values of <0.05 and <0.01 (not corrected for multiple testing).
Figure 5
Figure 5
Connectivity distribution. (A) Distribution of the number of binding sites per upstream region for the 700 known and putative TF binding sites (solid line), and the same distribution for a randomly permuted connectivity matrix (dashed line). (B) The distribution for non-TF genes (dashed line), and for TF genes (solid line).

References

    1. Altschul, S., Gish, W., Miller, W., Myers, E.W., and Lipman, D.J. 1990. Basic local alignment search tool. Proc. Natl. Acad. Sci. 87: 5509-5513. - PubMed
    1. Aparicio, S., Morrison, A., Gould, A., Gilthorpe, J., Chaudhuri, C., Rigby, P., Krumlauf R., and Brenner, S. 1995. Detecting conserved regulatory elements with the model genome of the Japanese puffer fish, Fugu rubripes. Proc. Natl. Acad. Sci. 92: 1684-1688. - PMC - PubMed
    1. Blanchette, M. and Tompa, M. 2002. Discovery of regulatory elements by a computational method for phylogenetic footprinting. Genome Res. 12: 739-748. - PMC - PubMed
    1. Bussemaker, H., Li, H., and Siggia, E.D. 2001. Regulatory element detection using correlation with expression. Nat. Genet. 27: 167-171. - PubMed
    1. Causton, H.C., Ren, B., Koh, S.S., Harbison, C.T., Kanin, E., Jennings, E.G., Lee, T.I., True, H.L., Lander, E.S., and Young, R.A. 2001. Remodeling of yeast genome expression in response to environmental changes. Mol. Biol. Cell 12: 323-337. - PMC - PubMed

Publication types

LinkOut - more resources