. 2003 Dec 10;23(36):11402-10.
doi: 10.1523/JNEUROSCI.23-36-11402.2003.

Imaging reveals synaptic targets of a swim-terminating neuron in the leech CNS

Affiliations

Imaging reveals synaptic targets of a swim-terminating neuron in the leech CNS

Adam L Taylor et al. J Neurosci. .

Abstract

In the leech, the command-like neuron called cell Tr2 is known to stop swimming, but the connections from cell Tr2 to the swim central pattern generator have not been identified. We used fluorescence resonance energy transfer voltage-sensitive dyes to identify three neurons that are synaptic targets of cell Tr2. We then used electrophysiological techniques to show that these connections are monosynaptic, chemical, and excitatory. Two of the novel targets, cell 256 and cell 54, terminate swimming when stimulated. These neurons are likely to mediate swim cessation caused by cell Tr2 activity, and thus play the role of intermediate control cells in the leech CNS.


Figures
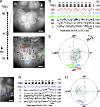
Figure 1.
Figure 1.
Optical discovery of cell Tr2 targets. A, A schematic of the preparation used to find cell Tr2 targets. The drawing represents the isolated leech nerve cord, consisting of the head brain (HB), 21 midbody ganglia (circles), and the tail brain (TB). Cell Tr2 was recorded intracellularly in the head brain, and the voltage-sensitive dye components were applied to a midbody ganglion, in this case ganglion 10. Ant, Anterior. B, The raw fluorescence image of ganglion 10, obtained by averaging all frames from a movie of cellular fluorescence over time. The frame includes the posterior medial packet and parts of the right and left posterior lateral packets, all of which are on the ventral side of the animal. Scale bar, 50 μm. C, Ellipses that were drawn by hand and used to average the pixels for each cell in the field. Each cell was given an arbitrary alphanumeric label unless it was impaled and definitively identified in that preparation. Cell p54(L) is likely to be cell 54(L) (p is for putative), but we did not impale it and verify its identity in this preparation. Colored cells were significantly coherent with the cell Tr2(L) electrical recording, at the α = 0.001 level (see Materials and Methods). Cells in black were not significantly coherent. Colors were chosen only to match up cells in C with traces in D and points in E; they are otherwise arbitrary. D, Simultaneous electrical recording of cell Tr2(L) and optical recordings from six of the cells shown in C. An increase in fluorescence reflects a depolarization of the cell. The optical traces are ordered by the magnitude of their coherence with the cell Tr2(L) electrical recording at 1 Hz. The coherence magnitude values are given to the right of each trace. The bars above the cell Tr2(L) voltage trace show when current was being passed into cell Tr2(L). E, Polar plot of the coherence between each optical recording and the cell Tr2 electrical recording, at the 1 Hz drive frequency, for the 43 cells circled in C. The distance from the center represents the coherence magnitude, and the angle represents the coherence phase. The outer circle represents a coherence magnitude of 1, the highest possible value. The dashed line indicates the α = 0.001 threshold for significance. The error bars represent 1 SE. A positive-negative phase angle means the signal leads or lags the cell Tr2 signal by that amount. All coherence estimates for fluorescence signals are shifted by +54°, to correct for the phase shift caused by the time constant of the dye response (see Materials and Methods). The data shown in A-E can also be presented as a movie, which is available at www.jneurosci.org. F, Analogous to C, but for a preparation in which cell 54(L) was impaled to identify it definitively. The circled cells are in the left posterior packet of the ventral side. Cells in the posterior medial packet cannot be seen clearly because they are above the focal plane. Scale bar, 50 μm. G, H, Analogous to D and E, but for the field shown in F.
Figure 2.
Figure 2.
Simultaneous electrical and optical recordings from a cell Tr2 target, cell 252. A, Simultaneously recordings of cell Tr2(R) voltage, cell 252(10) voltage, and cell 252(10) fluorescence. Note the clear 1 Hz component in the fluorescence signal, despite the small size of the membrane potential fluctuations. The first negative deflection of the cell 252(10) optical recording (arrow) seems to precede the stimulus onset because of the filtering used to debleach the optical signals (see Materials and Methods). B, Coherence of the optical and electrical recordings of cell 252(10), both with respect to the cell Tr2(R) membrane potential. As in Figure 1E, the coherence from the optical recording is shifted by +54° to correct for the phase shift caused by the time constant of the dye response (see Materials and Methods). The coherence for the electrical recording is not corrected. C, Activity in cells Tr2(R) and 252(10), triggered on cell Tr2 spikes. The black trace is a spike-triggered average of 21 individual sweeps, with the individual sweeps shown in gray. Each cell Tr2 spike is followed by an EPSP in cell 252, with a latency of 147 ± 3 msec (mean ± SD). The black bar under the cell Tr2 trace indicates when current was passed. opt, Optical; elec, electrical.
Figure 3.
Figure 3.
Monosynapticity and morphology of cell Tr2 targets. A, A series of spike-triggered averages (STAs) of simultaneous recordings from cells Tr2(L) and 256(10). In each case, the black trace shows the average of a number of individual sweeps, each of which is shown in gray. Four STAs, each from a different condition, are shown. The cell Tr2 spike that we used to trigger each sweep is shown only in the first condition for clarity of presentation. The cell Tr2 spike in normal saline is shown in the top trace. The black bar under the cell Tr2 trace indicates when current was passed. The second trace (Normal) is the simultaneously recorded activity in cell 256. The third trace (20/20) is the cell 256 recording from an STA done in 20 mm Ca2+/20 mm Mg2+ saline. The fourth trace (0/20) is in 0 mm Ca2+/20 mm Mg2+ saline. The bottom trace (Wash) is again in normal saline. The four different salines were applied in that order, in a single preparation. Number of sweeps per condition are as follows: normal, 19; 20/20, 11; 0/20, 11; Wash, 11. B, Analogous data to that shown in A but for cell 252. Number of sweeps per condition are as follows: normal, 21; 20/20, 21; 0/20, 11; Wash, 21. C, Analogous data to that shown in A, but for cell 54. Number of sweeps per condition are as follows: normal, 6; 20/20, 20; 0/20, 20; Wash, 20. D, Confocal image of cell 256 filled with the fluorescent dye tetramethylrhodamine dextran. E, Confocal image of cell 252 filled with the fluorescent dye Alexa 488. F, Confocal image of cell 54(R) and 54(L), filled with the fluorescent dyes tetramethylrhodamine dextran and Alexa 488, respectively.
Figure 4.
Figure 4.
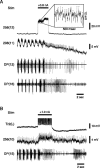
Cell 256 stops swimming. A, Examples of a swim terminated by cell 256. Simultaneous recordings from cell 256(12), cell 208(11) (a swim CPG cell), and the DP nerves in segments 12 and 16 are shown. Bursts of spikes in the DP nerves at ∼1 Hz indicate an ongoing swim episode (Ort et al., 1974). The bar indicates when current (+0.8 nA) was being passed. The inset shows the spiking activity of cell 256. Individual spikes are indicated by dots. The average spike rate of cell 256 during current passage was 32 Hz in this trial. B, Cell 256 activity during a cell Tr2-induced swim termination. Simultaneous recordings from cell Tr2(L), cell 256(10), and the DP nerve in segment 15 during a cell Tr2-induced swim stop are shown. The bar shows when current was passed. Current was delivered in a 4 sec train of 25 msec, +1.0 nA pulses at 20 Hz. The cell Tr2 recording saturated during current passage and is truncated in the figure. The average spike rate of cell 256(10) during the stimulus was 7.3 Hz.
Figure 5.
Figure 5.
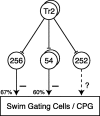
Summary of cell Tr2 targets and their effects on swimming. Connections drawn with bars indicate monosynaptic chemical excitatory connections. Arrows with negative signs next to them indicate an observed inhibitory effect the neuronal basis of which has not been identified. Percentages next to arrows indicate the fraction of animals in which the given cell (or cell pair, for cells 54) was effective in stopping swimming. The dashed arrow with a question mark next to it indicates an unknown effect.

Similar articles

Cited by

References

    1. Berry MS, Pentreath VW ( 1976) Criteria for distinguishing between monosynaptic and polysynaptic transmission. Brain Res 105: 1-20. - PubMed
    1. Brodfuehrer PD, Burns A ( 1995) Neuronal factors influencing the decision to swim in the medicinal leech. Neurobiol Learn Mem 63: 192-199. - PubMed
    1. Brodfuehrer PD, Friesen WO ( 1986a) Initiation of swimming activity by trigger neurons in the leech subesophageal ganglion. I. Output connections of Tr1 and Tr2. J Comp Physiol [A] 159: 489-502. - PubMed
    1. Brodfuehrer PD, Friesen WO ( 1986b) Initiation of swimming activity by trigger neurons in the leech subesophageal ganglion. II. Role of segmental swim-initiating interneurons. J Comp Physiol [A] 159: 503-510. - PubMed
    1. Byrne JH, Castellucci VF, Kandel ER ( 1978) Contribution of individual mechanoreceptor sensory neurons to defensive gill-withdrawal reflex in Aplysia J Neurophysiol 41: 418-431. - PubMed

Publication types