. 2003 Dec 23;100(26):16077-82.
doi: 10.1073/pnas.2536719100. Epub 2003 Dec 12.

Gi protein activation in intact cells involves subunit rearrangement rather than dissociation

Affiliations

Gi protein activation in intact cells involves subunit rearrangement rather than dissociation

Moritz Bünemann et al. Proc Natl Acad Sci U S A. .

Abstract

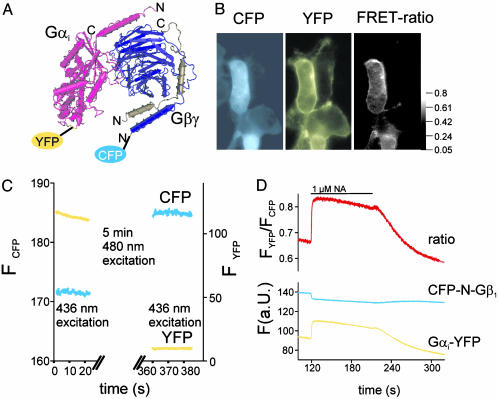
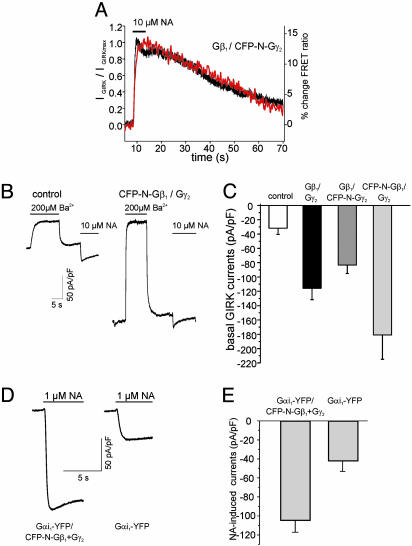
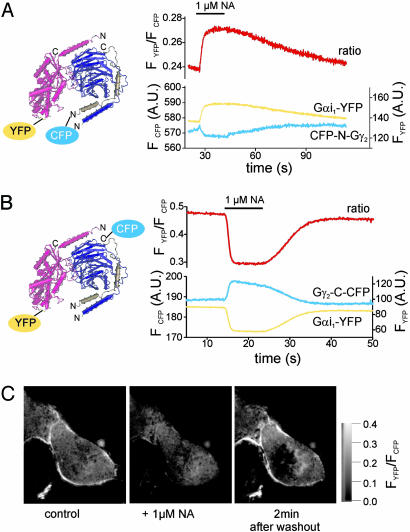
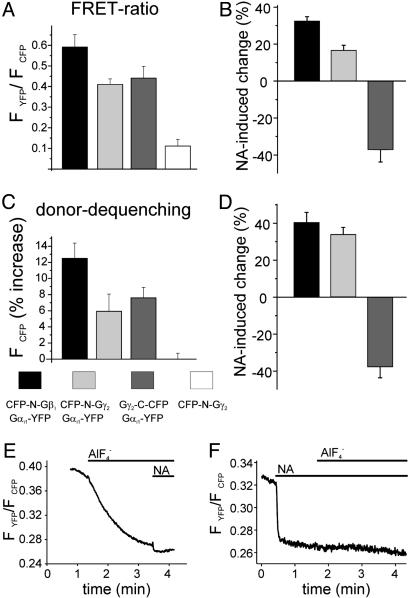
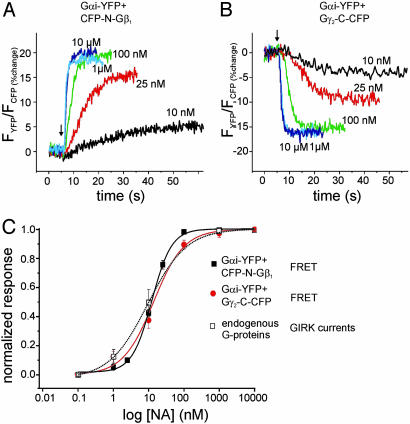
G protein-coupled receptors transduce diverse extracellular signals, such as neurotransmitters, hormones, chemokines, and sensory stimuli, into intracellular responses through activation of heterotrimeric G proteins. G proteins play critical roles in determining specificity and kinetics of subsequent biological responses by modulation of effector proteins. We have developed a fluorescence resonance energy transfer (FRET)-based assay to directly measure mammalian G protein activation in intact cells and found that Gi proteins activate within 1-2 s, which is considerably slower than activation kinetics of the receptors themselves. More importantly, FRET measurements demonstrated that Galphai- and Gbetagamma-subunits do not dissociate during activation, as has been previously postulated. Based on FRET measurements between Galphai-yellow fluorescent protein and Gbetagamma-subunits that were fused to cyan fluorescent protein at various positions, we conclude that, instead, G protein subunits undergo a molecular rearrangement during activation. The detection of a persistent heterotrimeric composition during G protein activation will impact the understanding of how G proteins achieve subtype-selective coupling to effectors. This finding will be of particular interest for unraveling Gbetagamma-induced signaling pathways.


Figures

Fig. 1.
Fig. 1.
Increase in FRET on activation of fluorescent G protein subunits. A structural model of a heterotrimeric Gi protein is depicted, and insertion sites for YFP and CFP are indicated. (B) Fluorescence microscopy images of HEK cells transiently transfected with Gαi-YFP, CFP-N-Gβ1, and Gγ2 were recorded by using either 436-nm (Left and Right) and 500-nm excitation (Center) and emission filters for CFP (Left) or YFP (Center and Right). FRET was determined by using donor dequenching after APB (YFP) (C) of a representative cell expressing fluorescent G proteins as described in B. NA-induced activation of coexpressed α2A-AR resulted in a rapid and reversible increase in the emission ratio of YFP and CFP on 436-nm excitation (D).
Fig. 5.
Fig. 5.
Coupling of fluorescent G protein subunits to GIRK channels. HEK cells expressing PTX-insensitive Gαi-YFP, Gβ1, CFP-N-Gγ2 (A), α2A-AR and GIRK1/4 channels were subsequently to 3-5 h of pretreatment with 50 ng/ml PTX subjected to whole-cell patch-clamp recording. The response to superfusion with 10 μM NA of both simultaneously recorded photometric FRET detection (red) and whole-cell GIRK currents (black) are illustrated as representative experiments (A). To compare kinetics of the FRET and GIRK current response, GIRK currents were normalized to the maximal response and traces were scaled to the maximal response (A). Gβγ-subunits N-terminally tagged with CFP (of either the Gβ1- or Gγ2-subunit) activated basal (agonist-independent) GIRK currents when expressed without Gαi-subunits (B and C). Currents carried by GIRK channels in the absence of agonist were determined by transient application of 200μMBa2+, and subsequently currents induced in response to α2A-AR stimulation were measured (B, representative current recordings; C, summarized data of basal GIRK current densities determined in 8-10 experiments per condition). GIRK current activation was mediated by G proteins composed of Gαi-YFP, CFP-N-Gβ1, and Gγ2 (D and E). Cells were transfected with these G protein subunits as well as with α2A-AR and GIRK1/4 channel subunits, and NA-induced whole-cell GIRK currents were recorded in an inward direction at -90 mV (D, representative current traces; E, summarized current densities).
Fig. 2.
Fig. 2.
FRET uncovers molecular switch function of heterotrimeric Gi proteins. HEK cells transfected with Gαi-YFP and Gβ1- and a Gγ2-subunit N-terminally fused to CFP (compare Fig. 1 A) exhibited an increase in FRET on α2A-AR-mediated activation (A). Fusion of the CFP to the C terminus of the Gγ2-subunit induced a decrease in FRET on activation in cells expressing Gαi-YFP and Gβ1 (B). By using FRET imaging, the NA-induced decrease in FRET was found to occur primarily at the plasma membrane (C).
Fig. 3.
Fig. 3.
FRET determined by two independent methods. Summarized data for FRET ratio measurements (A and B) and FRET determined by donor dequenching after APB (C and D) are illustrated for all three G protein FRET pairs. Agonist-mediated changes (10 μM NA-induced change of initial FRET values) were measured either by using FRET ratio measurements (B) or by donor dequenching after APB (D). We note that, to avoid negative FRET values of the ratiometrically determined FRET, the lowest measured bleed-through of CFP to the YFP channel was used to correct YFP channel data (A). To compare the fraction of fluorescent G proteins susceptible for activation by α2A-AR to the total pool of fluorescent G proteins, cells expressing α2A-AR, Gαi-YFP, Gβ1, and Gγ2-C-CFP were exposed either before (E) or after (F) application of NA (1 μM) to formula image (10 mM NaF and 50 μM AlCl3).
Fig. 4.
Fig. 4.
Concentration-response curves for α2A-AR-mediated G protein activation. HEK cells stably expressing 2 pmol α2A-AR per mg membrane protein were transiently transfected with heterotrimeric Gi proteins composed of Gαi-YFP, CFP-N-Gβ1, and Gγ2 (A and C, black squares) or Gαi-YFP, Gβ1, and Gγ2-C-CFP (B and C, red circles). NA-induced changes in the FRET signal were recorded in dependence of agonist concentration by using FRET ratio measurements. To compare coupling of the receptor to fluorescent G proteins with its coupling to endogenous G proteins, concentration-response curves of the FRET signals were compared with previously published data (23) regarding GIRK channel activation measured in the identical cell line (C, open squares). Summarized data of five to eight experiments were fitted with sigmoidal curves resulting in the following parameters: Gαi-YFP, Gβ1, and Gγ2-C-CFP: 13.7 nM/1.0; Gαi-YFP, CFP-N-Gβ1, and Gγ2: 12.3 nM/1.56; GIRK currents: 9.4 nM/0.78 (EC50/Hill coefficient).

References

    1. Wall, M. A., Coleman, D. E., Lee, E., Iniguez-Lluhi, J. A., Posner, B. A., Gilman, A. G. & Sprang, S. R. (1995) Cell 83, 1047-1058. - PubMed
    1. Lambright, D. G., Sondek, J., Bohm, A., Skiba, N. P., Hamm, H. E. & Sigler, P. B. (1996) Nature 379, 311-319. - PubMed
    1. Mixon, M. B., Lee, E., Coleman, D. E., Berghuis, A. M., Gilman, A. G. & Sprang, S. R. (1995) Science 270, 954-960. - PubMed
    1. Doupnik, C. A., Davidson, N., Lester, H. A. & Kofuji, P. (1997) Proc. Natl. Acad. Sci. USA 94, 10461-10466. - PMC - PubMed
    1. Watson, N., Linder, M. E., Druey, K. M., Kehrl, J. H. & Blumer, K. J. (1996) Nature 383, 172-175. - PubMed

Publication types

MeSH terms

Substances

LinkOut - more resources