. 2003 Dec 23;100(26):15522-7.
doi: 10.1073/pnas.2136632100. Epub 2003 Dec 12.

Network component analysis: reconstruction of regulatory signals in biological systems

Affiliations

Network component analysis: reconstruction of regulatory signals in biological systems

James C Liao et al. Proc Natl Acad Sci U S A. .

Abstract

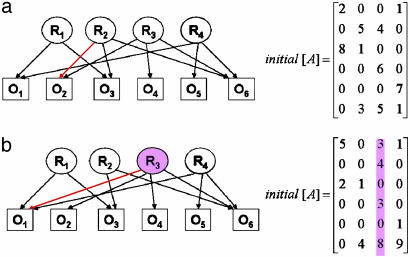
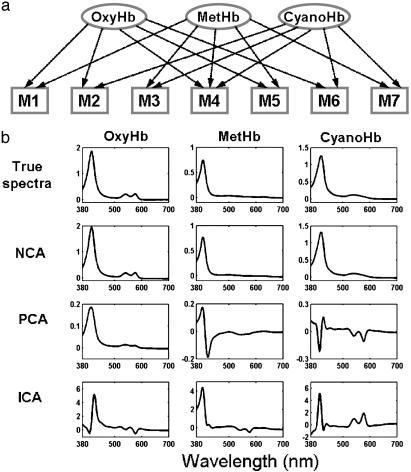
High-dimensional data sets generated by high-throughput technologies, such as DNA microarray, are often the outputs of complex networked systems driven by hidden regulatory signals. Traditional statistical methods for computing low-dimensional or hidden representations of these data sets, such as principal component analysis and independent component analysis, ignore the underlying network structures and provide decompositions based purely on a priori statistical constraints on the computed component signals. The resulting decomposition thus provides a phenomenological model for the observed data and does not necessarily contain physically or biologically meaningful signals. Here, we develop a method, called network component analysis, for uncovering hidden regulatory signals from outputs of networked systems, when only a partial knowledge of the underlying network topology is available. The a priori network structure information is first tested for compliance with a set of identifiability criteria. For networks that satisfy the criteria, the signals from the regulatory nodes and their strengths of influence on each output node can be faithfully reconstructed. This method is first validated experimentally by using the absorbance spectra of a network of various hemoglobin species. The method is then applied to microarray data generated from yeast Saccharamyces cerevisiae and the activities of various transcription factors during cell cycle are reconstructed by using recently discovered connectivity information for the underlying transcriptional regulatory networks.


Figures

Fig. 1.
Fig. 1.
A regulatory system in which the output data are driven by regulatory signals through a bipartite network. Network component analysis (NCA) takes advantage of partial network connectivity knowledge and is able to reconstruct regulatory signals and the weighted connectivity strength. For example, if a regulatory node or factor is known from experimental evidence to have negligible or no effect on an output signal, then the corresponding edge may be removed or, equivalently, its weight may be set to zero. As discussed in the text, such qualitative knowledge for a number of large biological systems is becoming available through high-throughput experiments. In contrast, traditional methods such as PCA and ICA depend on statistical assumptions and cannot reconstruct regulatory signals or connectivity strength.
Fig. 2.
Fig. 2.
A completely identifiable network (a) and an unidentifiable network (b). Although the two initial [A] matrices describing the network matrices have an identical number of constraints (zero entries), the network in b does not satisfy the identifiability conditions because of the connectivity pattern of R3. The edges in red are the differences between the two networks.
Fig. 3.
Fig. 3.
Experimental validation of the NCA method using absorbance spectra of hemoglobin solutions. OxyHb, oxyhemoglobin; MetHb, methemoglobin; CyanoHb, cyano-methemoglobin. (a) The connectivity (mixing) diagram of the seven Hb solutions from three pure components that serve as the regulatory nodes. (b) The regulatory signals (pure component spectra) derived from NCA agree well with the true values, whereas those derived from PCA or ICA do not.
Fig. 4.
Fig. 4.
S. cerevisiae cell cycle regulation. (a) The histogram of mean absolute errors (MAE) shows that the majority of the genes were fitted reasonably well. MAE is defined as formula image. (b) The dynamics of the TFAs for 11 transcription factors involved in cell cycle regulation. Different stages in the cell cycle are indicated by the color code. Rows I, II, and III represent experiments using different synchronization methods: elutriation, α factor arrest, and arrest of a cdc15 temperature-sensitive mutant, respectively. Shaded areas span four standard deviations (estimated by using a bootstrap technique as explained in Appendix 3). (c) The comparison between expression levels and activities of selected transcription factors shows that the expression levels do not exhibit an oscillatory behavior, whereas TFAs do.

References

    1. Schena, M., Shalon, D., Davis, R. W. & Brown, P. O. (1995) Science 270, 467–470. - PubMed
    1. Raychaudhuri, S., Stuart, J. M. & Altman, R. B. (2000) Pac. Symp. Biocomput. 5, 455–466. - PMC - PubMed
    1. Holter, N. S., Mitra, M., Maritan, A., Cieplak, M., Banavar, J. R. & Fedoroff, N. V. (2000) Proc. Natl. Acad. Sci. USA 97, 8409–8414. - PMC - PubMed
    1. Holter, N. S., Maritan, A., Cieplak, M., Fedoroff, N. V. & Banavar, J. R. (2001) Proc. Natl. Acad. Sci. USA 98, 1693–1698. - PMC - PubMed
    1. Yeung, M. K., Tegner, J. & Collins, J. J. (2002) Proc. Natl. Acad. Sci. USA 99, 6163–6168. - PMC - PubMed

LinkOut - more resources