. 2003 Dec 23;100(26):15492-7.
doi: 10.1073/pnas.2533045100. Epub 2003 Dec 12.

Probing protein oligomerization in living cells with fluorescence fluctuation spectroscopy

Affiliations

Probing protein oligomerization in living cells with fluorescence fluctuation spectroscopy

Yan Chen et al. Proc Natl Acad Sci U S A. .

Erratum in

  • Proc Natl Acad Sci U S A. 2004 Feb 10;101(6):1792

Abstract

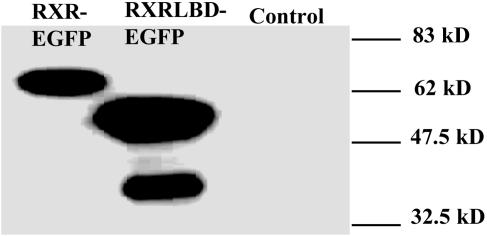
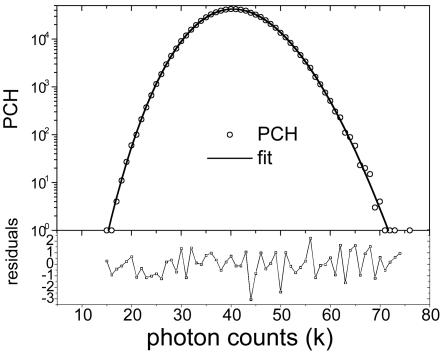
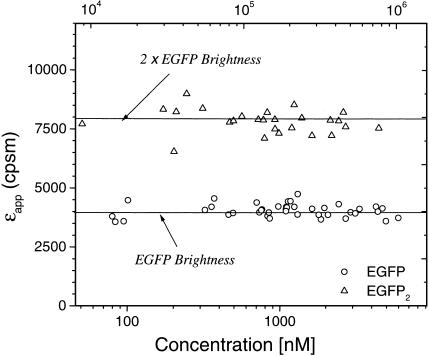
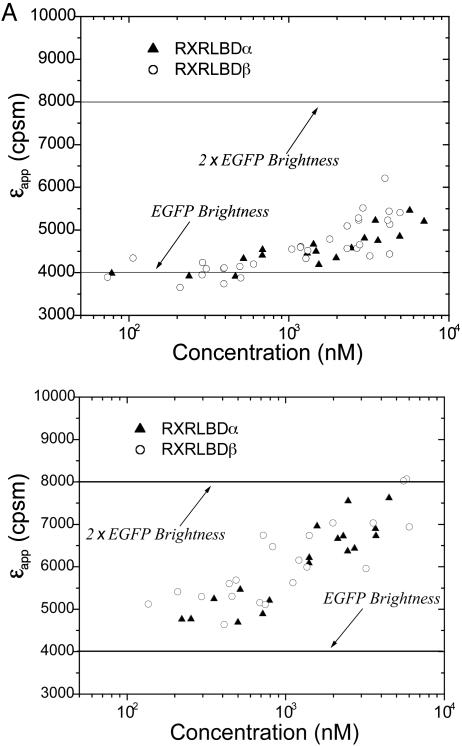
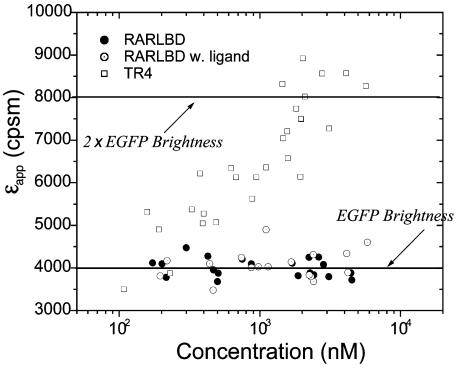
Fluorescence fluctuation spectroscopy provides information about protein interactions in the intercellular environment from naturally occurring equilibrium fluctuations. We determine the molecular brightness of fluorescent proteins from the fluctuations by analyzing the photon counting histogram (PCH) or its moments and demonstrate the use of molecular brightness in probing the oligomerization state of proteins. We report fluorescence fluctuation measurements of enhanced GFP (EGFP) in cells up to concentrations of 10 microM by using an improved PCH theory. The molecular brightness of EGFP is constant in the concentration range studied. The brightness of a tandem EGFP construct, which carries two fluorophores, increases by a factor of two compared with EGFP alone, demonstrating the sensitivity of molecular brightness as a probe for protein complex formation. Oligomerization of nuclear receptors plays a crucial role in the regulation of gene expression. We probe the oligomerization state of the testicular receptor 4 and the ligand-binding domains of retinoid X receptor and retinoic acid receptor by observing molecular brightness changes as a function of protein concentration. The large concentration range accessible by experiment allows us to perform titration experiments on EGFP fusion proteins. An increase in the molecular brightness with protein concentration indicates the formation of homocomplexes. We observe the formation of homodimers of retinoid X receptor ligand binding domain upon addition of ligand. Resolving protein interactions in a cell is an important step in understanding cellular function on a molecular level. Brightness analysis promises to develop into an important tool for determining protein complex formation in cells.


Figures

Fig. 1.
Fig. 1.
Western blot analysis of RXR-EGFP and RXR-LBD-EGFP and endogenous RXR from COS-1 cells. COS-1 cells transfected with RXR-EGFP or RXR-LBD-EGFP and nontransfected cells (control) are analyzed. Samples of whole cell lysate (RXR-EGFP, 60 μg; RXR-LBD-EGFP, 60 μg; control, 120 μg) were subjected to SDS/PAGE, transferred to poly(vinylidene difluoride) membrane, and followed by reaction with anti-RXR antibody (Affinity Bioreagents, Golden, CO). The RXR-LBD-EGFP sample displays degraded receptor with lower molecular weight that was not observed in the control.
Fig. 2.
Fig. 2.
Representative PCH of EGFP measured in the nucleus of a COS cell. The power at the sample is 0.6 mW. The solid line represents a fit to a single species PCH model with a detector deadtime of 50 ns. The fit recovers a particle number N of 208 and a brightness ε of 4,100 cpsm. (Lower) The normalized residuals of the fit. The reduced χ2 for this fit is 1.1.
Fig. 3.
Fig. 3.
Molecular brightness of EGFP and EGFP2 as a function of the average photon count rate and protein concentration. The brightness of EGFP (circles) and EGFP2 (triangles) are concentration independent. Each data point represents the brightness measured in a different cell expressing either EGFP or EGFP2. Note that the brightness of EGFP2 is twice the brightness of EGFP alone. The concentration axis shows the total protein concentration expressed in terms of monomeric EGFP concentration. The average molecular brightness of EGFP (solid line) is 4,000 cpsm with a standard deviation of 300 cpsm. The average molecular brightness of the tandem protein EGFP2 (dashed line) is 7,800 cpsm with a standard deviation of 508 cpsm.
Fig. 4.
Fig. 4.
Titration of RXR-LBDα-EGFP and RXR-LBDβ-EGFP in the absence (A) and presence (B) of 1 μM 9-cis-retinoic acid. The receptor concentration is calculated based on the brightness of EGFP (solid line). (A) The apparent brightness εapp increases as a function of protein concentration and indicates the formation of homocomplexes. The response of RXR-LBDα-EGFP and RXR-LBDβ-EGFP are identical. (B) Addition of ligand promotes the formation of homodimers.
Fig. 5.
Fig. 5.
Titration of RAR-LBD-EGFP and TR4-EGFP nuclear receptors in COS cells. The receptor concentration is calculated based on the brightness of EGFP (solid line). The apparent brightness of RAR-LBD-EGFP in the absence (•) and presence (⊙) of all-trans-retinoic acid is identical to the brightness of EGFP. The brightness of TR4 (□) increases with protein concentration and reaches a brightness that is twice the value of EGFP.

References

    1. Magde, D., Elson, E. & Webb, W. W. (1972) Phys. Rev. Lett. 29, 705–708.
    1. Chen, Y., Müller, J. D., So, P. T. & Gratton, E. (1999) Biophys. J. 77, 553–567. - PMC - PubMed
    1. Qian, H. & Elson, E. L. (1990) Proc. Natl. Acad. Sci. USA 87, 5479–5483. - PMC - PubMed
    1. Kask, P., Palo, K., Ullmann, D. & Gall, K. (1999) Proc. Natl. Acad. Sci. USA 96, 13756–13761. - PMC - PubMed
    1. Müller, J. D., Chen, Y. & Gratton, E. (2000) Biophys. J. 78, 474–486. - PMC - PubMed

Publication types

LinkOut - more resources