. 2003 Dec 23;100(26):15554-9.
doi: 10.1073/pnas.2534386100. Epub 2003 Dec 12.

Visualizing lipid structure and raft domains in living cells with two-photon microscopy

Affiliations

Visualizing lipid structure and raft domains in living cells with two-photon microscopy

Katharina Gaus et al. Proc Natl Acad Sci U S A. .

Abstract

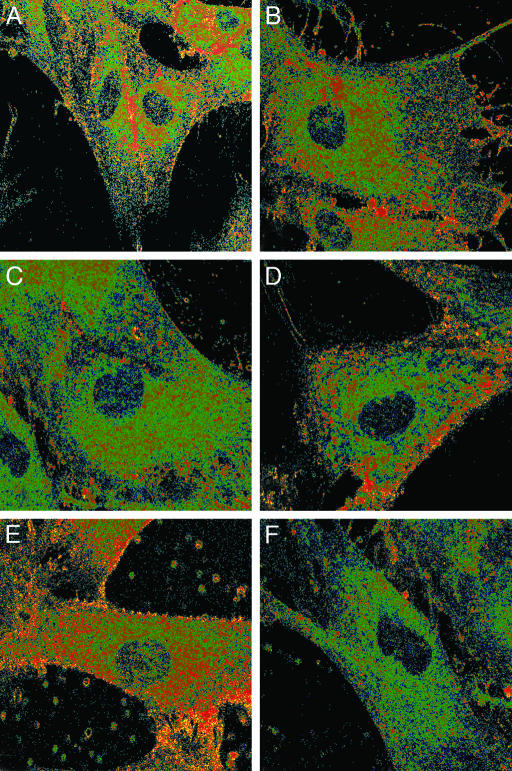
The lateral organization of cellular membranes is formed by the clustering of specific lipids, such as cholesterol and sphingolipids, into highly condensed domains (termed lipid rafts). Hence such domains are distinct from the remaining membrane by their lipid structure (liquid-ordered vs. -disordered domains). Here, we directly visualize membrane lipid structure of living cells by using two-photon microscopy. In macrophages, liquid-ordered domains are particularly enriched on membrane protrusions (filopodia), adhesion points and cell-cell contacts and cover 10-15% of the cell surface at 37 degrees C. By deconvoluting the images, we demonstrate the existence of phase separation in vivo. We compare the properties of microscopically visible domains (<1 microm2), with those of isolated detergent-resistant membranes and provide evidence that membrane coverage by lipid rafts and their fluidity are principally governed by cholesterol content, thereby providing strong support for the lipid raft hypothesis.


Figures

Fig. 1.
Fig. 1.
GP images of living macrophages, GP distribution, and temperature dependency. 3D-reconstructed pseudocolored GP images of RAW264.7 cell (image plane parallel to coverslip, viewed from above) (A) and THP-1 cell (viewed from below) (B). Circled area (arrow) 126 pixels/0.73 μm2; widths are 28.3 μm(A) and 39.0 μm(B). (C) Distribution of a stack of GP images (⋄) was deconvoluted by fitting two Gaussian distributions to the experimental data (black line) with centers of GP = 0.140 (center C1) and GP = 0.549 (center C2). Area under each curve equates to surface coverage. (D) Temperature dependence of the GP centers (□, C1, slope –0.0112; ⋄, C2 slope –0.0132; left axis) and coverage of center C2 as percent of all Laurdan-stained pixels (Δ slope –3.566, right axis). Solid symbols are the means of 10–12 stacks (Table 1); open symbols are data from single stack.
Fig. 2.
Fig. 2.
GP images of fibroblasts. GP image of living (A) or fixed (B) fibroblasts (4% paraformaldehyde, 30 min, 4°C) were obtained as described for macrophages. Cells were treated with 10 mM mCD for 1 h at 37°C (C), nonspecifically crosslinked with 0.5 mM BS3 (D), or patched with anti-transferrin receptor and secondary antibodies (E). For F, fibroblasts were first mCD-treated and then antibody patched. The same pseudocoloring as in Fig. 1 was used. The widths of the images are 114.0 μm(A), 89.1 μm(B), 79.7 μm(C), 59.1 μm(D), 66.5 μm (E), and 73.2 μm (F).
Fig. 3.
Fig. 3.
Colocalization of caveolin-1 and transferrin receptor with high or low GP domains. A single GP image (A) was converted into a dual-colored image so that GP domains of GP <0.3 are blue, and domains with GP >0.3 are red (B). Single-photon confocal immunofluorescent images for transferrin receptor (C) and caveolin-1 (D) were obtained as outlined in Methods, pseudocolored green, and merged with B [transferrin receptor (E), caveolin-1 (F)]. Light blue indicates a colocalization with low GP domains, and yellow indicates a colocalization with high GP domains. The width of each image is 47.3 μm.
Fig. 4.
Fig. 4.
GP images of living cells with varied cholesterol content. RAW264.7 cells were treated at 22°C with mCD (1.0 mg/m) for 0 min (A), 2.5 min (B), 5 min (C), and 10 min (D), or with mCD-Chol (0.5 mg/ml) for 0 min (E), 5 min (F), 25 min (G), and 60 min (H). Images were pseudocolored, as indiciated in H.(AD) Vertical and horizontal eclipses (each 260 pixels, 3.3 μm2) indicate a high (mean GP = 0.57, decreasing by –0.044 min–1) and low (mean GP = 0.081, decreasing by –0.0074 min–1) GP domain, respectively. Filled arrow indicates a filopodium retracting during mCD treatment; open arrow, a membrane evagination appearing to pinch off. (EH) The initial (0–25 min) shift to higher GP values on cholesterol loading declines after 60 min, although some filopodia remain more condensed. Open arrow indicates a membrane evagination extending during treatment; closed arrow shows increasing cell–cell contact points. Note an additional cell migrating from the left. Widths: 58.0 μm (AD) and 51.2 μm (EH).

References

    1. Simons, K. & Toomre, D. (2000) Nat. Rev. Mol. Cell. Biol. 1, 31–39. - PubMed
    1. Brown, D. A. & London, E. (1998) Annu. Rev. Cell Dev. Biol. 14, 111–136. - PubMed
    1. Ikonen, E. (2001) Curr. Opin. Cell Biol. 13, 470–477. - PubMed
    1. Simons, K. & Ikonen, E. (1997) Nature 387, 569–572. - PubMed
    1. London, E. (2002) Curr. Opin. Struct. Biol. 12, 480–486. - PubMed

Publication types