. 2003 Dec 23;42(50):14977-87.
doi: 10.1021/bi0354334.

Free-energy landscapes of ion-channel gating are malleable: changes in the number of bound ligands are accompanied by changes in the location of the transition state in acetylcholine-receptor channels

Affiliations

Free-energy landscapes of ion-channel gating are malleable: changes in the number of bound ligands are accompanied by changes in the location of the transition state in acetylcholine-receptor channels

Claudio Grosman. Biochemistry. .

Abstract

Acetylcholine-receptor channels (AChRs) are allosteric membrane proteins that mediate synaptic transmission by alternatively opening and closing ("gating") a cation-selective transmembrane pore. Although ligand binding is not required for the channel to open, the binding of agonists (for example, acetylcholine) increases the closed right harpoon over left harpoon open equilibrium constant because the ion-impermeable --> ion-permeable transition of the ion pathway is accompanied by a low-affinity --> high-affinity change at the agonist-binding sites. The fact that the gating conformational change of muscle AChRs can be kinetically modeled as a two-state reaction has paved the way to the experimental characterization of the corresponding transition state, which represents a snapshot of the continuous sequence of molecular events separating the closed and open states. Previous studies of fully (di) liganded AChRs, combining single-channel kinetic measurements, site-directed mutagenesis, and data analysis in the framework of the linear free-energy relationships of physical organic chemistry, have suggested a transition-state structure that is consistent with channel opening being an asynchronous conformational change that starts at the extracellular agonist-binding sites and propagates toward the intracellular end of the pore. In this paper, I characterize the gating transition state of unliganded AChRs, and report a remarkable difference: unlike that of diliganded gating, the unliganded transition state is not a hybrid of the closed- and open-state structures but, rather, is almost indistinguishable from the open state itself. This displacement of the transition state along the reaction coordinate obscures the mechanism underlying the unliganded closed right harpoon over left harpoon open reaction but brings to light the malleable nature of free-energy landscapes of ion-channel gating.


Figures

Figure 1:
Figure 1:
Putative threading pattern of an AChR subunit through the membrane. This pattern is thought to be conserved throughout the superfamily of cys-loop receptor subunits (which includes, in vertebrates, the subunits that form acetylcholine nicotinic receptors, serotonin type 3 receptors, glycine receptors, and γ-aminobutyric acid type A and type C receptors). The M2 domain is thought to be a transmembrane, mostly α-helical segment with 19 intramembrane residues (referred to as 1’ to 19’, from the intracellular to the extracellular end). Five M2 segments, each contributed by a different subunit of the pentameric receptor-channel, form most of the lining of the membrane pore (). An alternative threading pattern with M1 having as many as three non-helical transmembrane passes has been recently proposed (). This discrepancy, however, does not compromise the conclusions of this work. The adult form of the muscle-type AChR is formed by four different subunits (α, β, δ, and ε) in an α2βδε stoichiometry.
Figure 2:
Figure 2:
Continuous recording of single-channel inward currents and corresponding dwell-time histograms from unliganded αS269I AChRs. (A) Openings are downward deflections. For display purposes only, the bandwidth was reduced to 6 kHz. (B) Experimental dwell-time histograms and calculated density functions. The latter were computed from the rate-constant estimates (see legend to Figure 5), taking into account that a dead time of 25 μs was imposed on the idealized open and shut intervals. In this particular patch, the time constants (and areas) of the shut-time distribution were 99 μs (0.021), 124 μs (0.011), 7.6 ms (0.041), and 167 ms (0.927). For the open times, these were 95 μs (0.570), 280 μs (0.403), and 4.0 ms (0.027). The longest-lived openings occurred in bursts of 1.8 openings, on average. In other words, 30 % of these openings occurred as isolated events, 27 % occurred as pairs of openings separated by one brief gap, 18 % formed triplets containing two gaps, 11 % came as quartets with three gaps, and so on.
Figure 3:
Figure 3:
Continuous recording of single-channel inward currents and corresponding dwell-time histograms from unliganded δL265T AChRs. (A) Openings are downward deflections. For display purposes only, the bandwidth was reduced to 6 kHz. (B) Experimental dwell-time histograms and calculated density functions. The latter were computed from the rate-constant estimates (see legend to Figure 5), taking into account that a dead time of 25 μs was imposed on the idealized open and shut intervals. In this particular patch, the time constants (and areas) of the shut-time distribution were 36 μs (0.009), 166 μs (0.025), 877 μs (0.038), 23 ms (0.250), 47 ms (0.667), 283 ms (0.009), and 2.0 s (0.001). For the open times, these were 149 μs (0.589), 600 μs (0.347), and 4.7 ms (0.064). The longest-lived openings occurred in bursts of 1.7 openings, on average. In other words, 33 % of these openings occurred as isolated events, 28 % occurred as pairs of openings separated by one brief gap, 18 % formed triplets containing two gaps, 10 % came as quartets with three gaps, and so on.
Figure 4:
Figure 4:
Continuous recording of single-channel inward currents and corresponding dwell-time histograms from unliganded αL251A AChRs. (A) Openings are downward deflections. For display purposes only, the bandwidth was reduced to 6 kHz. (B) Experimental dwell-time histograms and calculated density functions. The latter were computed from the rate-constant estimates (see legend to Figure 5), taking into account that a dead time of 25 μs was imposed on the idealized open and shut intervals. In this particular patch, the time constants (and areas) of the shut-time distribution were 16 μs (0.006), 36 μs (0.006), 370 μs (0.008), 22 ms (0.923), 49 ms (0.056), and 382 ms (0.001). For the open times, these were 130 μs (0.583), 452 μs (0.379), and 3.1 ms (0.038). The longest-lived openings occurred in bursts of 1.4 openings, on average. In other words, 54 % of these openings occurred as isolated events, 29 % occurred as pairs of openings separated by one brief gap, 11 % formed triplets containing two gaps, 4 % came as quartets with three gaps, and so on.
Figure 5:
Figure 5:
Example reaction scheme used to interpret unliganded-AChR single-channel currents. The letters C and O denote non-conductive (‘shut’) and conductive (‘open’) conformations of the receptor-channel, respectively. The number of states in the model depended on the extent to which their inclusion/omission affected the maximum log-likelihood of the fit. Additional states were justified only if their inclusion increased this value by at least five units per state. The O1 state was needed in all the recordings whereas O2 and O3 were needed in only some of them. Additional shut states, which were needed in most experiments, were added to C0 as a linear chain.
Figure 6:
Figure 6:
Rate-equilibrium plots of diliganded and unliganded gating for an M2 12′-mutant series. The slope of the choline-diliganded plot was -0.737 (Φ = slope + 1 = 0.263; refs , ). The slope of the unliganded plot, however, was 0.033 (Φ = 1.033). Thus, the gating Φ-value at position M2 12’ depends on the occupancy status of the transmitter-binding sites.
Figure 7:
Figure 7:
Relationship between simulated and estimated rate constants. To mimic the experimentally-recorded unliganded AChR data, single-channel currents were simulated using a two-state, closed ⇌ open kinetic scheme with QuB software. To determine how accurate the estimates of the fastest closing rate constant are, the opening rate constant was fixed at an arbitrary value of 500 s-1, whereas the closing rate constant was varied from 5,000 s-1 to 200,000 s-1. The single-channel current amplitude (6.0 pA) and the root-mean-square noise of the closed (1.5 pA; 20-kHz bandwidth) and open (1.6 pA; 20-kHz bandwidth) current levels were set to values similar to those recorded experimentally. Simulated currents were idealized (20-kHz bandwidth) using the SKM algorithm, and the corresponding rate constants were estimated using the MIL algorithm, both in QuB software. Each point in the plot represents the average of five rate-constant estimates, each resulting from an independent simulation. In turn, each rate-constant estimate was the result of the analysis of the same number of open/shut intervals (5,000 after the imposition of a dead time). Hence, the deviation from the ideal relationship (dotted lines in both plots) cannot be ascribed to differences in the number of intervals analyzed. The shape of these plots is very sensitive to a number of variables, including the signal-to-noise ratio of the current recordings, the rate at which the currents were digitized, the bandwidth used for idealization, and the dead time imposed on the idealized data before the estimation of rate constants (the latter is explicitly illustrated in the Figure; the experimentally recorded data were analyzed with a value of 25 μs). Therefore, these plots should not be regarded as a general property of the algorithms implemented in the software but merely as an indication of the accuracy with which rate constants were estimated in this particular paper.
Figure 8:
Figure 8:
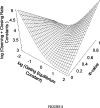
Simulation of rate-equilibrium plots at different Φ-values in the case where the forward and backward rate constants of a one-step reaction can only be estimated as their sum. The intrinsic opening and closing rate constant (i.e., the value of these rate constants when the equilibrium constant is equal to 1; see Eqs. 2 and 3 in Experimental Procedures) was arbitrarily set at 1,000 s-1. The particular value of this rate constant does not affect the shape of this plot; it simply shifts it up or down.

Similar articles

Cited by

References

    1. Edmonds B, Gibb AJ, Colquhoun D. Annu. Rev. Physiol. 1995;57:469–493. - PubMed
    1. Karlin, A. Nature Reviews Neurosci. 2002;3:102–114. - PubMed
    1. Karlin A. J. Theor. Biol. 1967;16:306–320. - PubMed
    1. Jackson MB. Proc. Natl. Acad. Sci. USA. 1989;86:2199–2203. - PMC - PubMed
    1. Edelstein SJ, Changeux J-P. Adv. Prot. Chem. 1998;51:121–184. - PubMed

Publication types

MeSH terms