Interventional magnetic resonance imaging for guiding gene and cell transfer in the heart
- PMID: 14676253
- PMCID: PMC1768020
- DOI: 10.1136/heart.90.1.87
Interventional magnetic resonance imaging for guiding gene and cell transfer in the heart
Abstract
Background: Interventional magnetic resonance imaging (iMRI) has the potential for guiding interventional cardiac procedures in real time.
Objectives: To test the feasibility of iMRI guided gene and cell transfer to the heart and to monitor myocardial remodelling after myocardial infarction in a rat model.
Methods: The MRI contrast agent GdDTPA, together with either Evans blue dye, or a recombinant adenovirus encoding the LacZ gene, or primary fibroblasts tagged by BrdU, were injected into the myocardium of rats under iMRI guidance. Rats were killed seven days after the injection and the hearts sectioned to identify the blue dye, LacZ expression, or fibroblast presence, respectively. In a parallel study, left ventricular area was measured before and after myocardial infarction and in sham operated rats by T1 weighted MRI and by echocardiography.
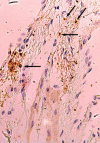
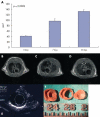
Results: Location of GdDTPA enhancement observed with iMRI at the time of injection was correlated with Evans blue stain, beta-gal expression, and the primary fibroblast location in histological studies. iMRI and echocardiography measured a comparable increase in left ventricular area at seven and 30 days after myocardial infarction. A good correlation was found between the iMRI and echocardiographic assessment of left ventricular area (r = 0.70; p < 0.0001) and change in left ventricular area with time (r = 0.75; p < 0.0001).
Conclusions: The results show the feasibility and efficiency of iMRI guided intramyocardial injections, and the ability to monitor heart remodelling using iMRI. Genes, proteins, or cells for tissue engineering could be injected accurately into the myocardial scar under iMRI guidance.
Figures


Comment in
-
Myocardial gene and cell delivery.Heart. 2004 Jan;90(1):1-2. doi: 10.1136/heart.90.1.1. Heart. 2004. PMID: 14676224 Free PMC article.
Similar articles
-
Adenovirus-mediated gene transfer into infarcted myocardium: feasibility, timing, and location of expression.J Mol Cell Cardiol. 1996 Oct;28(10):2057-67. doi: 10.1006/jmcc.1996.0199. J Mol Cell Cardiol. 1996. PMID: 8930802
-
Adenovirus-mediated overexpression of inhibitor kappa B-alpha attenuates postinfarct remodeling in the rat heart.Eur J Cardiothorac Surg. 2004 Nov;26(5):960-7. doi: 10.1016/j.ejcts.2004.07.043. Eur J Cardiothorac Surg. 2004. PMID: 15519190
-
Intracardiac echocardiographic guidance and monitoring during percutaneous endomyocardial gene injection in porcine heart.Hum Gene Ther. 2001 May 20;12(8):893-903. doi: 10.1089/104303401750195863. Hum Gene Ther. 2001. PMID: 11387055
-
MRI in guiding and assessing intramyocardial therapy.Eur Radiol. 2005 May;15(5):851-63. doi: 10.1007/s00330-004-2622-8. Epub 2005 Jan 29. Eur Radiol. 2005. PMID: 15856250 Review.
-
Gene transfer and cell transplant: an experimental approach to repair a 'broken heart'.Cardiovasc Res. 1997 Sep;35(3):431-41. doi: 10.1016/s0008-6363(97)00159-4. Cardiovasc Res. 1997. PMID: 9415287 Review. No abstract available.
Cited by
-
Interventional cardiovascular magnetic resonance: still tantalizing.J Cardiovasc Magn Reson. 2008 Dec 29;10(1):62. doi: 10.1186/1532-429X-10-62. J Cardiovasc Magn Reson. 2008. PMID: 19114017 Free PMC article. Review.
-
MRI roadmap-guided transendocardial delivery of exon-skipping recombinant adeno-associated virus restores dystrophin expression in a canine model of Duchenne muscular dystrophy.Gene Ther. 2013 Mar;20(3):274-82. doi: 10.1038/gt.2012.38. Epub 2012 May 3. Gene Ther. 2013. PMID: 22551778 Free PMC article.
-
Cardiac repair--fact or fancy?Heart Fail Rev. 2006 Jun;11(2):155-70. doi: 10.1007/s10741-006-9486-8. Heart Fail Rev. 2006. PMID: 16937035 Review.
-
Myocardial gene and cell delivery.Heart. 2004 Jan;90(1):1-2. doi: 10.1136/heart.90.1.1. Heart. 2004. PMID: 14676224 Free PMC article.
-
Interventional cardiovascular magnetic resonance imaging: a new opportunity for image-guided interventions.JACC Cardiovasc Imaging. 2009 Nov;2(11):1321-31. doi: 10.1016/j.jcmg.2009.09.002. JACC Cardiovasc Imaging. 2009. PMID: 19909937 Free PMC article. Review.
References
-
- Daniel BL. Intraprocedural magnetic resonance imaging-guided interventions in the breast. Top Magn Reson Imaging 2000;11:184–90. - PubMed
-
- Gehl HB, Frahm C. MRI-controlled biopsies. Radiologe 1998;38:194–9. - PubMed
-
- Seifert V, Zimmermann M, Trantakis C, et al. Open MRI-guided neurosurgery. Acta Neurochir (Wien) 1999;141:455–64. - PubMed
-
- Buecker A, Spuentrup E, Grabitz R, et al. Magnetic resonance-guided placement of atrial septal closure device in animal model of patent foramen ovale. Circulation 2002;106:511–15. - PubMed
-
- Sorger JM, Guttman MA, Wassmuth R, et al. Real-time MRI guided drug delivery [abstract]. Proc Int Soc Magn Reson Med 2001: abstract 2187.
Publication types
MeSH terms
Substances
LinkOut - more resources
Full Text Sources
Other Literature Sources
Medical
