. 2003 Dec 15;198(12):1875-86.
doi: 10.1084/jem.20030152.

Conversion of peripheral CD4+CD25- naive T cells to CD4+CD25+ regulatory T cells by TGF-beta induction of transcription factor Foxp3

Affiliations

Conversion of peripheral CD4+CD25- naive T cells to CD4+CD25+ regulatory T cells by TGF-beta induction of transcription factor Foxp3

WanJun Chen et al. J Exp Med. .

Abstract

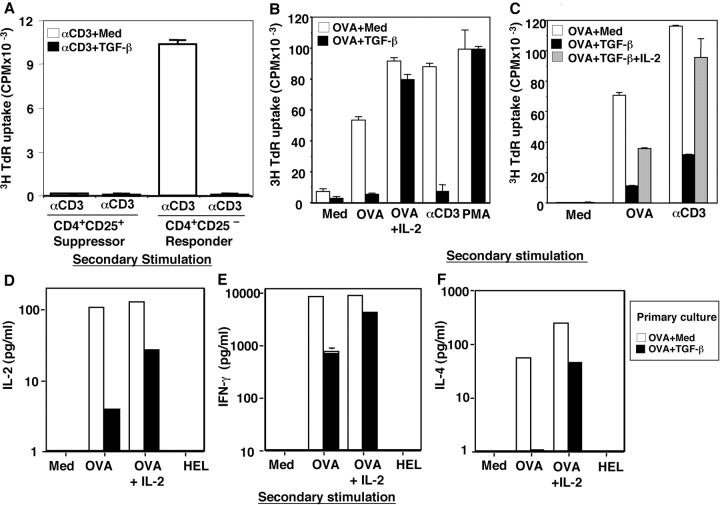
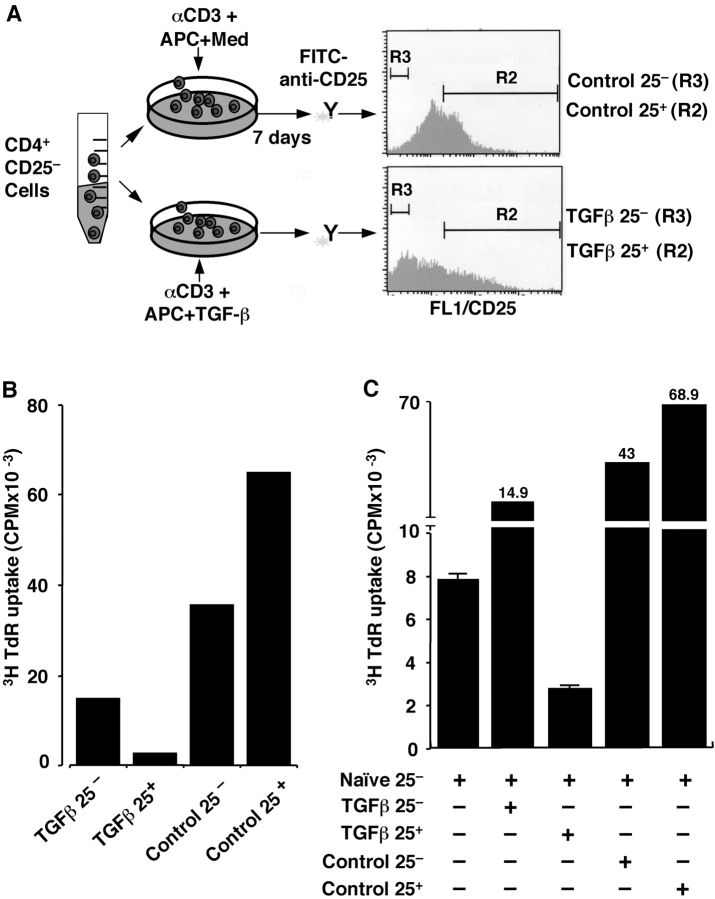
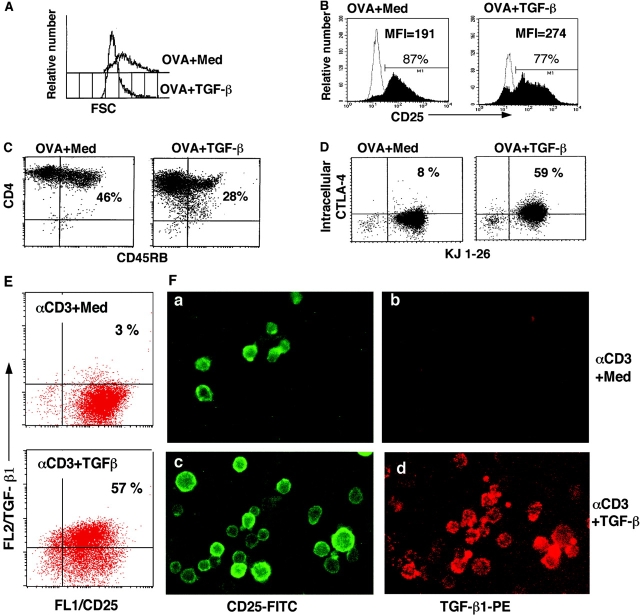
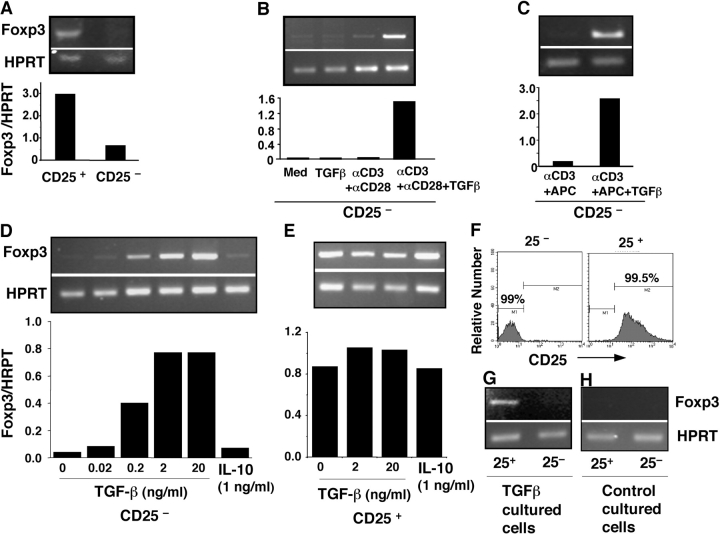
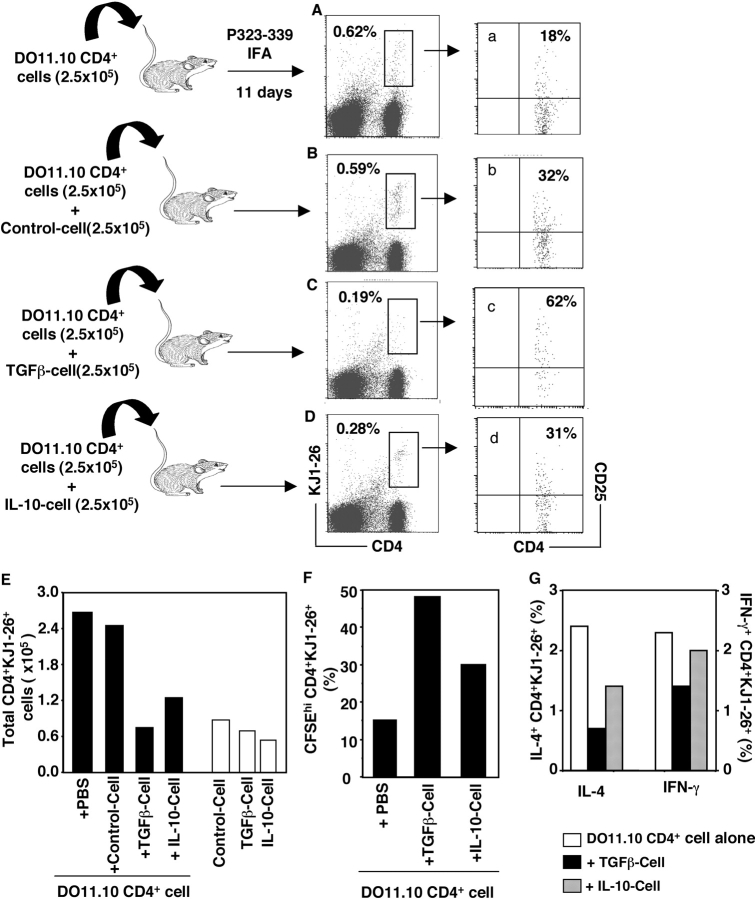
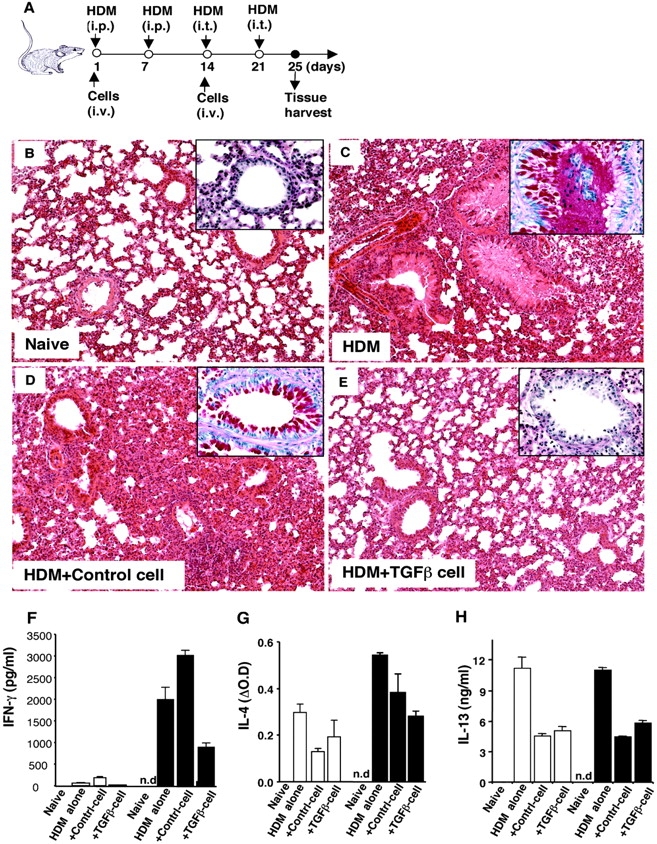
CD4+CD25+ regulatory T cells (Treg) are instrumental in the maintenance of immunological tolerance. One critical question is whether Treg can only be generated in the thymus or can differentiate from peripheral CD4+CD25- naive T cells. In this paper, we present novel evidence that conversion of naive peripheral CD4+CD25- T cells into anergic/suppressor cells that are CD25+, CD45RB-/low and intracellular CTLA-4+ can be achieved through costimulation with T cell receptors (TCRs) and transforming growth factor beta (TGF-beta). Although transcription factor Foxp3 has been shown recently to be associated with the development of Treg, the physiological inducers for Foxp3 gene expression remain a mystery. TGF-beta induced Foxp3 gene expression in TCR-challenged CD4+CD25- naive T cells, which mediated their transition toward a regulatory T cell phenotype with potent immunosuppressive potential. These converted anergic/suppressor cells are not only unresponsive to TCR stimulation and produce neither T helper cell 1 nor T helper cell 2 cytokines but they also express TGF-beta and inhibit normal T cell proliferation in vitro. More importantly, in an ovalbumin peptide TCR transgenic adoptive transfer model, TGF-beta-converted transgenic CD4+CD25+ suppressor cells proliferated in response to immunization and inhibited antigen-specific naive CD4+ T cell expansion in vivo. Finally, in a murine asthma model, coadministration of these TGF-beta-induced suppressor T cells prevented house dust mite-induced allergic pathogenesis in lungs.


Figures

Figure 1.
Figure 1.
Costimulation of TCR and TGF-β induces CD4+CD25 T cell anergy, but fails to expand existing Treg. (A) C57BL/6 CD25 naive cells or Treg (5 × 10⁴) were cultured (primary) with anti-CD3 and APCs (2 × 10⁶) in the absence (αCD3 + med) and presence (αCD3 + TGF-β) of 2 ng/ml TGF-β for 7 d. 3 × 10⁴ harvested viable CD4+ responder T cells or 5 × 10³ Treg were restimulated with anti-CD3 and APCs for 72 h to monitor their proliferation. The data are representative of three separate experiments. (B–F) TGF-β induces OVA TCR transgenic CD4+ T cells (KJ1-26+) anergy. 2 × 10⁶ cells/ml spleen cells were cultured with OVA in the presence or absence of TGF-β for 7–10 d (primary). Viable CD4+ T cells were purified and restimulated with 100 μg/ml OVA, 100 μg/ml hen egg lysozyme (HEL), 1 μg/ml anti-CD3 mAb, or 10 U/ml IL-2 as indicated in the presence of BALB/c APCs or with PMA and ionomycin (secondary stimulation). The values are expressed as mean ± SD of triplicate wells for 3H incorporation (CPM, 5 × 10⁴ T cells) (B and C) or of duplicate wells of the ELISA (D–F, 2 × 10⁴ T cells). (B) TGF-β induces transgenic CD4+ TCR-specific anergy. (C) Inclusion of exogenous IL-2 in primary cultures blocks TGF-β–induced CD4+ T cell anergy. (D–F) TGF-β induces both Th1 and Th2 cell anergy. Cytokine levels of IL-2 (D), IFN-γ (E), and IL-4 (F) in secondary culture supernatants (after 24–48 h) were determined by ELISA. The data shown were repeated from two to six times with similar results.
Figure 2.
Figure 2.
TGF-β converts naive CD4+CD25 T cells to CD4+ CD25+ anergic/suppressor T cells. (A) Schematic for the experiment. Freshly isolated B6 CD4+CD25 T cells were stimulated with anti-CD3 and APCs in the absence and presence of TGF-β for 1 wk. Viable CD4+ T cells were stained with FITC–anti-CD25 mAb, and four populations of cells (control 25, control 25+, TGF-β 25, and TGF-β 25+) were sorted by FACStarPlus™ Cell Sorter. (B) The individual populations (5 × 10⁴) were restimulated with anti-CD3 and APCs (2 × 10⁵) to monitor their proliferative response. The data are shown as mean of duplicate wells of 3H incorporation (CPM). (C) 1.5 × 10⁴ freshly isolated CD4+CD25 responder T cells were stimulated with anti-CD3 and APCs in the absence (naive CD25 alone) or presence of the four individual populations of cells (5 × 10⁴) to examine their suppressive ability for naive responder T cell activation. The data are representative of three experiments.
Figure 3.
Figure 3.
Phenotype of TGF-β–induced anergic/suppressor T cells. (A–D) DO11.10 TCR transgenic spleen cells were stimulated with OVA in the absence (OVA + Med) and presence of TGF-β (OVA + TGF-β) for 7 d. CD4+ T cells were purified and stained with PE–anti-CD4 and FITC–anti-CD25, or FITC–anti-CD45RB. CD4+ T cells (>98% KJ1-26+) were gated, and histogram profiles of cell size on FSC (A) and CD25 (B) are displayed. Profile of dual CD4 and CD45RB expression (C) CD4+ T cells purified at day 7 after the primary cultures were rested in complete DMEM for 56 h. Viable CD4+ T cells were stained with FITC-anti–KJ1-26 and intracellular PE-anti–CTLA-4. (D) TGF-β–induced anergic/suppressor T cells express membrane-bound TGF-β (E and F). B6 CD4+CD25 T cells were cultured with anti-CD3 and APCs in the absence (panels a and b, αCD3 + Med) or presence of TGF-β (panels c and d, αCD3 + TGF-β) for 3 d. After extensive washes, cells were stained with FITC–anti-CD25 and biotinylated chicken anti–TGF-β1, followed by streptavidin-PE. Cells were analyzed on flow cytometry and under immunofluorescence microscopy.
Figure 4.
Figure 4.
TGF-β and TCR costimulation induces Foxp3 expression in CD4+CD25 naive responder T cells. (A) B6 spleen cells were sorted into CD4+CD25 (CD25) and Treg (CD25+) populations. cDNA from each population was subjected to nonsaturating PCR using Foxp3 or HPRT-specific primers, and data are presented as Foxp3/HPRT ratio. (B) CD25 cells were cultured with medium or 2 ng/ml TGF-β1 (24 h) or stimulated with platebound anti-CD3 and soluble anti-CD28 in the absence or presence of TGF-β1 (72 h) and assessed for the expression of Foxp3 by RT-PCR. (C) CD25 cells were activated with soluble anti-CD3 and APCs with or without TGF-β for 3 d and assessed for Foxp3 expression. (D) Dose dependence of TGF-β and failure of IL-10 on Foxp3 induction in CD25 naive T cells. CD25 cells were cultured as in B in the presence of indicated concentrations of TGF-β or recombinant murine IL-10. (E) Both TGF-β and IL-10 failed to further enhance Foxp3 expression in Treg. Freshly isolated Treg were activated with platebound anti-CD3, soluble anti-CD28, and IL-2 (100 U/ml) with or without TGF-β or IL-10, and Foxp3 expression was assessed by RT-PCR. (F and G) Flow cytometry analysis (F) and Foxp3 expression (G) of CD25+ or CD25 T cells sorted from TGF-β– and anti-CD3–costimulated naive CD25 T cells (day 7). (H) No Foxp3 expression in both CD25+ and CD25 subsets purified from control (anti-CD3 only) stimulated CD25 naive cells (day 7). The data in the figure are representative of at least three experiments.
Figure 5.
Figure 5.
TGF-β–converted CD4+ suppressor T cells inhibited antigen-specific expansion of transgenic CD4+ T cells in vivo. Freshly isolated CD4+ KJ1-26+ T cells (DO11.10 CD4+ cells) or with equal number of OVA only (Control cell), plus 2 ng/ml TGF-β (TGF-β cell) or plus 1 ng/ml IL-10–converted (IL-10 cell) CD25+ KJ1-26+ T cells were injected i.p into normal BALB/c mice. Some mice were injected with 2.5 × 10⁵ of Control cell, TGF-β cell, or IL-10 cell alone. Mice were immunized with Peptide 323-339 emulsified with IFA on day 2. On day 11, draining lymph nodes (inguinal) were harvested, and cells were stained with Tricolor–anti-CD4, FITC–KJ1-26, and PE–anti-CD25 and analyzed on FACSCalibur™. (A–D) Live cells were gated, and the profiles between CD4 versus KJ1-26 are displayed. The numbers represent CD4+KJ1-26+ cell frequency within lymph node cells. The numbers in the parentheses are injected cells. Each group contained two mice and the lymph node cells were pooled before staining. (a–d) CD4+KJ1-26+ T cells in corresponding A–D were gated, and CD25+ frequency is shown. (E) Total CD4+KJ1-26+ T cells in draining lymph nodes per mouse (percentage of CD4+KJ1-26+ × the number of total lymph node cells/2). (F) 2 × 10⁶ lymph node cells labeled with 3 μM CFSE were cultured with 1 μg/ml Peptide 323-339 in 24-well plates for 72 h. Cells were stained with Tricolor–anti-CD4 and PE–KJ1-26 and analyzed on FACSCalibur™. CD4+KJ1-26+ cells were gated, and the CFSEhi cells are shown. The marker was set according to CFSE fluorescence of the live CD4+ KJ1-26+ T cells in parallel cultures with medium only. (G) 2 × 10⁶ lymph node cells were cultured with Peptide 323-339 in the presence of GolgiPlug™ for 5–6 h. Cells were stained with Tricolor–anti-CD4 and FITC–KJ1-26 antibodies before being fixed and intracellularly stained for IL-4 or IFN-γ cytokines with respective antibodies (PE-anti–IL-4 or PE-anti–IFN-γ, 0.5 μg/106 cells). 40,000–80,000 cells were acquired on FACSCalibur™, and percentages of KJ1-26+ IL-4+ or IFN-γ+ cells within CD4+ T cells are shown. The experiments were repeated twice with similar results.
Figure 6.
Figure 6.
TGF-β–converted-CD4+ suppressor T cells prevent HDM-induced allergic pathogenesis in vivo. B6 CD4+CD25 T cells were cultured with anti-CD3 and APCs in the absence (Control cell) and presence of TGF-β (TGF-β cell) for 3–5 d, extensively washed and rested in DMEM complete medium containing 10 U/ml of IL-2 for an additional 3 d. Viable cells were harvested, washed, and resuspended in PBS for injection. For induction of allergic immune responses in lungs, B6 mice were injected with HDM allergen as depicted in schematic plan (A). 4 d after the last HDM intratracheal challenge, mice were killed, and lungs were immediately fixed with 10% PBS-Formalin for immunohistological staining (H&E). One representative lung from each group (three to five mice) is shown. The magnification of the images is 20. (B) Naive lung. (C) HDM-injected lung. (D) HDM-injected lung coinjected with Control cell (106 on day 1 and 5 × 10⁵ on day 14, i.v.). (E) HDM-injected lungs coinjected with TGF-β cell (106 on day 1 and 5 × 10⁵ on day 14, i.v.). (inset) Boxed images are mucin staining in airways by PAS (40×). The red staining represents mucin positive cells. (F–H) Spleen cells were harvested and pooled from three to five mice per group. 4 × 10⁵ spleen cells were cultured with 100 μg/ml HDM (white bars) or 0.5 μg/ml anti-CD3 (black bars) for 24–96 h, the cell-free supernatants were collected to measure IFN-γ (F, 48 h), IL-4 (G, 24 h), and IL-13 (H, 96 h), respectively, by ELISA. IL-4 levels are shown as ΔOD (OD value of test supernatants − OD value of culture medium; OD = 0.107). n.d., not done.

References

    1. Sakaguchi, S. 2000. Regulatory T cells: key controllers of immunologic self-tolerance. Cell. 101:455–458. - PubMed
    1. Shevach, E.M. 2002. CD4+ CD25+ suppressor T cells: more questions than answers. Nat. Rev. Immunol. 2:389–400. - PubMed
    1. Itoh, M., T. Takahashi, N. Sakaguchi, Y. Kuniyasu, J. Shimizu, F. Otsuka, and S. Sakaguchi. 1999. Thymus and autoimmunity: production of CD25+CD4+ naturally anergic and suppressive T cells as a key function of the thymus in maintaining immunologic self-tolerance. J. Immunol. 162:5317–5326. - PubMed
    1. Apostolou, I., A. Sarukhan, L. Klein, and H. von Boehmer. 2002. Origin of regulatory T cells with known specificity for antigen. Nat. Immunol. 3:756–763. - PubMed
    1. Zhang, X., L. Izikson, L. Liu, and H.L. Weiner. 2001. Activation of CD25(+)CD4(+) regulatory T cells by oral antigen administration. J. Immunol. 167:4245–4253. - PubMed

MeSH terms