

A new tool for routine testing of cellular protein expression: integration of cell staining and analysis of protein expression on a microfluidic chip-based system
- PMID: 14676310
- PMCID: PMC2279899
A new tool for routine testing of cellular protein expression: integration of cell staining and analysis of protein expression on a microfluidic chip-based system
Abstract
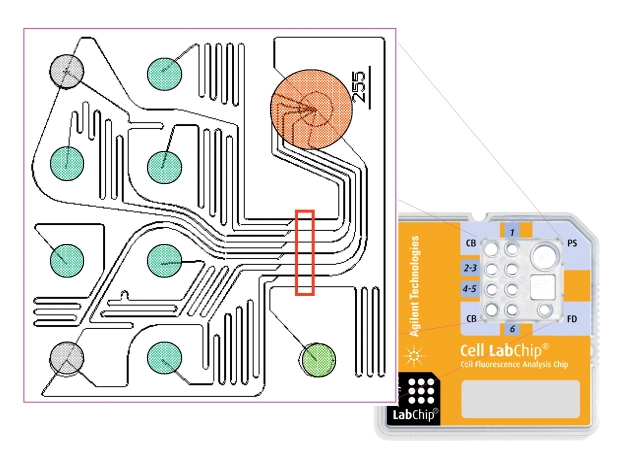
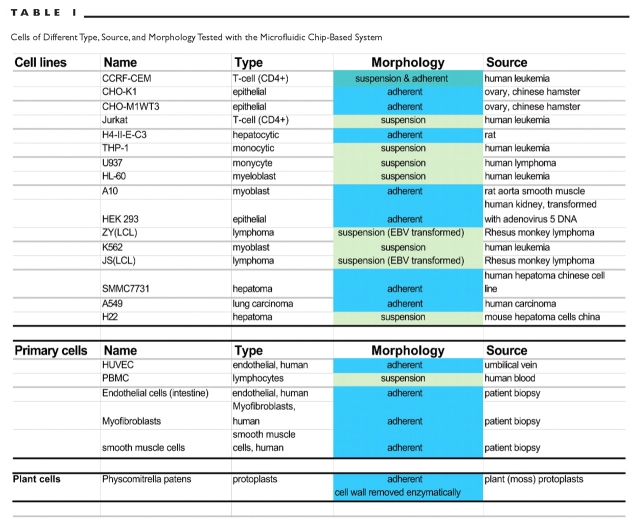
The key benefits of Lab-on-a-Chip technology are substantial time savings via an automation of lab processes, and a reduction in sample and reagent volumes required to perform analysis. In this article we present a new implementation of cell assays on disposable microfluidic chips. The applications are based on the controlled movement of cells by pressure-driven flow in microfluidic channels and two-color fluorescence detection of single cells. This new technology allows for simple flow cytometric studies of cells in a microfluidic chip-based system. In addition, we developed staining procedures that work "on-chip," thus eliminating time-consuming washing steps. Cells and staining-reagents are loaded directly onto the microfluidic chip and analysis can start after a short incubation time. These procedures require only a fraction of the staining reagents generally needed for flow cytometry and only 30,000 cells per sample, demonstrating the advantages of microfluidic technology. The specific advantage of an on-chip staining reaction is the amount of time, cells, and reagents saved, which is of great importance when working with limited numbers of cells, e.g., primary cells or when needing to perform routine tests of cell cultures as a quality control step. Applications of this technology are antibody staining of proteins and determination of cell transfection efficiency by GFP expression. Results obtained with microfluidic chips, using standard cell lines and primary cells, show good correlation with data obtained using a conventional flow cytometer.
Figures

Similar articles
-
Cytometric analysis of protein expression and apoptosis in human primary cells with a novel microfluidic chip-based system.Cytometry A. 2003 Oct;55(2):119-25. doi: 10.1002/cyto.a.10070. Cytometry A. 2003. PMID: 14505317
-
Single-cell analysis of yeast, mammalian cells, and fungal spores with a microfluidic pressure-driven chip-based system.Cytometry A. 2004 Jun;59(2):246-53. doi: 10.1002/cyto.a.20049. Cytometry A. 2004. PMID: 15170604
-
Small volume low mechanical stress cytometry using computer-controlled Braille display microfluidics.Lab Chip. 2007 Nov;7(11):1497-503. doi: 10.1039/b708187a. Epub 2007 Aug 15. Lab Chip. 2007. PMID: 17960277
-
Microfluidic lab-on-a-chip platforms: requirements, characteristics and applications.Chem Soc Rev. 2010 Mar;39(3):1153-82. doi: 10.1039/b820557b. Epub 2010 Jan 25. Chem Soc Rev. 2010. PMID: 20179830 Review.
-
Chemical cytometry on microfluidic chips.Electrophoresis. 2008 May;29(9):1775-86. doi: 10.1002/elps.200700561. Electrophoresis. 2008. PMID: 18384067 Review.
Cited by
-
Baculovirus-mediated gene transfer and recombinant protein expression do not interfere with insulin dependent phosphorylation of PKB/Akt in human SHSY-5Y and C3A cells.BMC Cell Biol. 2007 Feb 19;8:6. doi: 10.1186/1471-2121-8-6. BMC Cell Biol. 2007. PMID: 17309805 Free PMC article.
-
Development of Microfluidic Systems Enabling High-Throughput Single-Cell Protein Characterization.Sensors (Basel). 2016 Feb 16;16(2):232. doi: 10.3390/s16020232. Sensors (Basel). 2016. PMID: 26891303 Free PMC article. Review.
-
Fluorescent proteins and their use in marine biosciences, biotechnology, and proteomics.Mar Biotechnol (NY). 2007 May-Jun;9(3):305-28. doi: 10.1007/s10126-006-7145-7. Epub 2007 Mar 19. Mar Biotechnol (NY). 2007. PMID: 17372780 Review.
-
pH controlled staining of CD4(+) and CD19(+) cells within functionalized microfluidic channel.Biomicrofluidics. 2012 Nov 5;6(4):44107. doi: 10.1063/1.4763560. eCollection 2012. Biomicrofluidics. 2012. PMID: 24191176 Free PMC article.
-
Single-cell analysis of embryoid body heterogeneity using microfluidic trapping array.Biomed Microdevices. 2014 Feb;16(1):79-90. doi: 10.1007/s10544-013-9807-3. Biomed Microdevices. 2014. PMID: 24085533 Free PMC article.
References
-
- Preckel T, Luedke G, Chan SDH, Wang B, Dubrow R, Buhlmann C. Detection of cellular parameters using a microfluidic chip-based sytem. J Assoc Lab Autom 2002; 7:85–89
-
- Ohashi R, Otero JM, Chwistek A, Hamel JFP. Determination of monoclonal antibody production in cell culture using novel microfluidic and traditional assays. Electrophoresis 2002;23:3623–3629 - PubMed
-
- Fuller RA, Clark J, Kretzner L, et al. Use of microfluidics chips for the detection of human telomerase RNA. Anal Biochem 2003;313:331–334 - PubMed
-
- Girndt M, Sester M, Sester U, Kaul H, Kohler H. Defective expression of B7-2 (CD86) on monocytes of dialysis patients correlates to the uremia-associated immune defect. Kidney Int 2001:59:1382–1389 - PubMed
-
- Luedke G, Preckel T. Detection of antibody stained cell surface and intracellular protein targets with the Agilent 2100 bioanalyzer. Agilent App Note 2001; 5988–4322EN
MeSH terms
Substances
LinkOut - more resources
Full Text Sources
Other Literature Sources
Miscellaneous