

Signalling pathway of nitric oxide in synaptic GABA release in the rat paraventricular nucleus
- PMID: 14678495
- PMCID: PMC1664752
- DOI: 10.1113/jphysiol.2003.053371
Signalling pathway of nitric oxide in synaptic GABA release in the rat paraventricular nucleus
Abstract
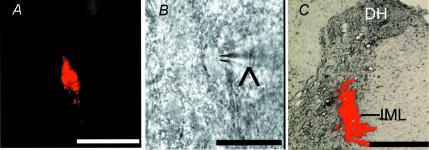
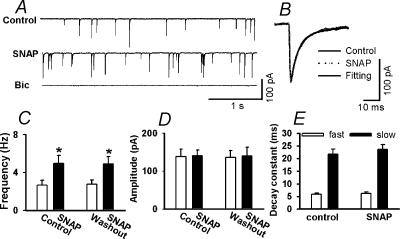
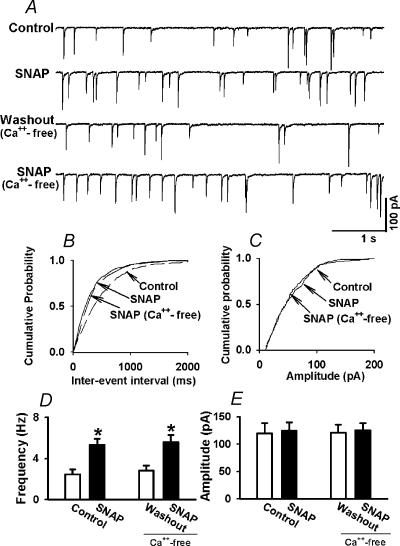
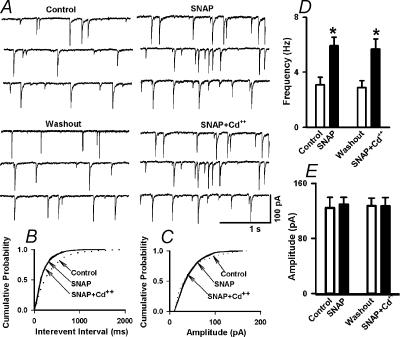
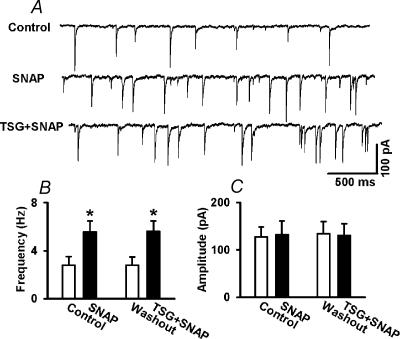
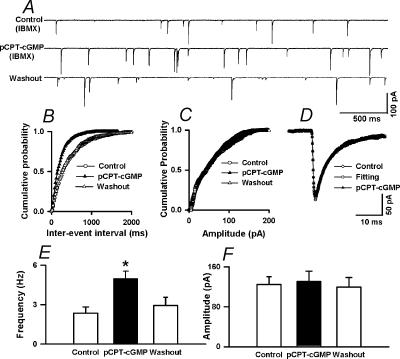
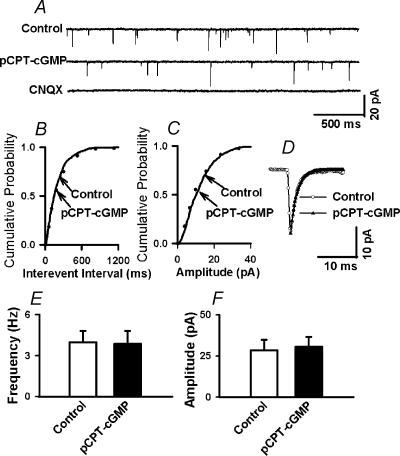
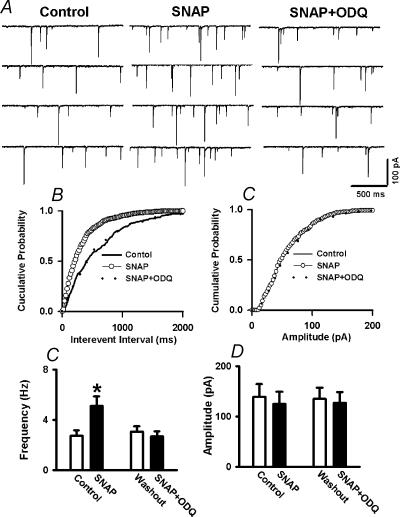
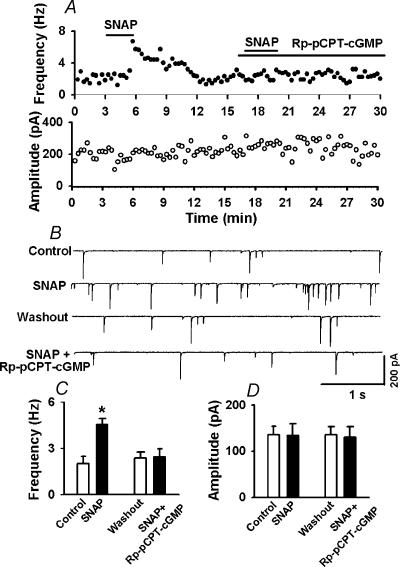
In the paraventricular nucleus (PVN) of the hypothalamus, nitric oxide (NO) inhibits sympathetic outflow through increased GABA release. However, the signal transduction pathways involved in its action remain unclear. In the present study, we determined the role of cGMP, soluble guanylyl cyclase, and protein kinase G in the potentiating effect of NO on synaptic GABA release to spinally projecting PVN neurones. The PVN neurones were retrogradely labelled by a fluorescent tracer injected into the thoracic spinal cord of rats. Whole-cell voltage-clamp recordings were performed on labelled PVN neurones in the hypothalamic slice. Bath application of the NO donor, S-nitroso-N-acetyl-penicillamine (SNAP), reproducibly increased the frequency of miniature GABAergic inhibitory postsynaptic currents (mIPSCs) without changing the amplitude and the decay time constant. Neither replacement of Ca2+ with Co2+ nor application of Cd2+ to block the Ca2+ channel altered the effect of SNAP on mIPSCs. Also, the effect of SNAP on mIPSCs was not significantly affected by thapsigargin, a Ca2+-ATPase inhibitor that depletes intracellular Ca2+ stores. Application of a membrane-permeant cGMP analogue, pCPT-cGMP, mimicked the effect of SNAP on mIPSCs in the presence of a phosphodiesterase inhibitor, IBMX. Furthermore, both the soluble guanylyl cyclase inhibitor, ODQ, and the specific protein kinase G inhibitor, Rp pCPT cGMP, abolished the effect of SNAP on mIPSCs. Thus, these data provide substantial new information that NO potentiates GABAergic synaptic inputs to spinally projecting PVN neurones through a cGMP-protein kinase G pathway.
Figures
Similar articles
-
Nitric oxide inhibits spinally projecting paraventricular neurons through potentiation of presynaptic GABA release.J Neurophysiol. 2002 Nov;88(5):2664-74. doi: 10.1152/jn.00540.2002. J Neurophysiol. 2002. PMID: 12424302
-
Kv1.1/1.2 channels are downstream effectors of nitric oxide on synaptic GABA release to preautonomic neurons in the paraventricular nucleus.Neuroscience. 2007 Oct 26;149(2):315-27. doi: 10.1016/j.neuroscience.2007.08.007. Epub 2007 Aug 8. Neuroscience. 2007. PMID: 17869444
-
Calcium channel activation facilitated by nitric oxide in retinal ganglion cells.J Neurophysiol. 2000 Jan;83(1):198-206. doi: 10.1152/jn.2000.83.1.198. J Neurophysiol. 2000. PMID: 10634867
-
Cyclic guanosine monophosphate in the regulation of the cell function.Postepy Hig Med Dosw (Online). 2016 Dec 27;70(0):1276-1285. Postepy Hig Med Dosw (Online). 2016. PMID: 28026830 Review.
-
Nitric oxide: a local signalling molecule controlling the activity of pre-autonomic neurones in the paraventricular nucleus of the hypothalamus.Acta Physiol Scand. 2003 Jan;177(1):37-42. doi: 10.1046/j.1365-201X.2003.01045.x. Acta Physiol Scand. 2003. PMID: 12492777 Review.
Cited by
-
Excitatory and anti-oscillatory actions of nitric oxide in thalamus.J Physiol. 2008 Aug 1;586(15):3617-28. doi: 10.1113/jphysiol.2008.153312. Epub 2008 Jun 5. J Physiol. 2008. PMID: 18535092 Free PMC article.
-
Effect of sildenafil on neuropathic pain and hemodynamics in rats.Yonsei Med J. 2010 Jan;51(1):82-7. doi: 10.3349/ymj.2010.51.1.82. Epub 2009 Dec 29. Yonsei Med J. 2010. PMID: 20046518 Free PMC article.
-
Vasopressin & Oxytocin in Control of the Cardiovascular System: An Updated Review.Curr Neuropharmacol. 2020;18(1):14-33. doi: 10.2174/1570159X17666190717150501. Curr Neuropharmacol. 2020. PMID: 31544693 Free PMC article. Review.
-
Nitric oxide modulation of GABAergic synaptic transmission in mechanically isolated rat auditory cortical neurons.Korean J Physiol Pharmacol. 2009 Dec;13(6):461-7. doi: 10.4196/kjpp.2009.13.6.461. Epub 2009 Dec 31. Korean J Physiol Pharmacol. 2009. PMID: 20054493 Free PMC article.
-
AT1 Receptor Mediated Hypertensive Response to Ang II in the Nucleus Tractus Solitarii of Normotensive Rats Involves NO Dependent Local GABA Release.Front Pharmacol. 2019 May 3;10:460. doi: 10.3389/fphar.2019.00460. eCollection 2019. Front Pharmacol. 2019. PMID: 31130861 Free PMC article.
References
-
- Ahern GP, Klyachko VA, Jackson MB. cGMP and S-nitrosylation: two routes for modulation of neuronal excitability by. Trends Neurosci. 2002;25:510–517. - PubMed
-
- Allen AM. Inhibition of the hypothalamic paraventricular nucleus in spontaneously hypertensive rats dramatically reduces sympathetic vasomotor tone. Hypertension. 2002;39:275–280. - PubMed
-
- Boulton CL, Irving AJ, Southam E, Potier B, Garthwaite J, Collingridge GL. The nitric oxide–cyclic GMP pathway and synaptic depression in rat hippocampal slices. Eur J Neurosci. 1994;6:1528–1535. - PubMed
-
- Furuyama T, Inagaki S, Takagi H. Localizations of alpha 1 and beta 1 subunits of soluble guanylate cyclase in the rat brain. Brain Res Mol Brain Res. 1993;20:335–344. - PubMed
-
- Guevara-Guzman R, Emson PC, Kendrick KM. Modulation of in vivo striatal transmitter release by nitric oxide and cyclic GMP. J Neurochem. 1994;62:807–810. - PubMed
Publication types
MeSH terms
Substances
Grants and funding
LinkOut - more resources
Full Text Sources
Miscellaneous