. 2004 Jan 1;554(Pt 1):111-25.
doi: 10.1113/jphysiol.2003.050989.

Pacemaker channels in mouse thalamocortical neurones are regulated by distinct pathways of cAMP synthesis

Affiliations

Pacemaker channels in mouse thalamocortical neurones are regulated by distinct pathways of cAMP synthesis

Samuel G A Frère et al. J Physiol. .

Abstract

A crucial aspect of pacemaker current (Ih) function is the regulation by cyclic nucleotides. To assess the endogenous mechanisms controlling cAMP levels in the vicinity of pacemaker channels, Ih regulation by G-protein-coupled neurotransmitter receptors was studied in mouse thalamocortical neurones. Activation of beta-adrenergic receptors with (-)-isoproterenol (Iso) led to a small steady enhancement of Ih amplitude, whereas activation of GABAB receptors with (+/-)-Baclofen (Bac) reduced Ih, consistent with an up- and down-regulation of basal cAMP levels, respectively. In contrast, a transient (taudecay, approximately 200 s), supralinear up-regulation of Ih was observed upon coapplication of Iso and Bac that was larger than that observed with Iso alone. This up-regulation appeared to involve a cAMP synthesis pathway distinct from that recruited by Iso, as it was associated with a reversible acceleration in Ih activation kinetics and an occlusion of modulation by photolytically released cAMP, yet showed an 11 mV as opposed to a 6 mV positive shift in the activation curve and an at least seven-fold increase in duration. GABA, in the presence of the GABAA antagonist picrotoxin, mimicked, whereas N-ethylmaleimide, an inhibitor of Gi-proteins, blocked the up-regulation, supporting a requirement for GABAB receptor activation in the potentiation. Activation of synaptic GABAB responses via stimulation of inhibitory afferents from the nucleus reticularis potentiated Iso-induced increments in Ih, suggesting that synaptically located receptors couple positively to cAMP synthesis induced by beta-adrenergic receptors. These findings indicate that distinct pathways of cAMP synthesis target the pacemaker current and the recruitment of these may be controlled by GABAergic activity within thalamic networks.


Figures

Figure 1
Figure 1. Iso and Bac modulate Ih in a manner consistent with the coupling of β-adrenergic and GABAB receptors to adenylyl cyclase
A, bath application of Iso (500 nM) induced a small steady enhancement of Ih amplitude to 128.0 ± 4.3% of control (n= 6, P < 0.001). Inset shows an overlay of Ih activated during a voltage step from −62 to −92 mV in control and during Iso application at steady-state. B, activation curve of Ih in the absence (○) and in the presence (•) of Iso. Activation curves were constructed from tail current analysis and normalized to the maximal current under control conditions. This yielded V0.5=−94.4 ± 0.6 mV in control and V0.5=−87.6 ± 1.0 mV in Iso, respectively (n= 4, P < 0.05). C, bath application of a saturating concentration of Bac induced a steady reduction in Ih amplitude (•) to 74.6 ± 3.3% (n= 15, P < 0.02). This effect was not associated with a decrease in the input resistance of the neurone (□), but rather a small increase to 111.6 ± 9.0% of control (n= 7, P > 0.05), probably due to decreased Ih amplitude. Inset shows an overlay of Ih activated during a voltage step from −62 to −92 mV in control and during Bac application in steady-state. D, evaluation of the relative tail current amplitudes of Ih shows that Bac induced a leftward shift in V0.5 of the activation curve from −92.0 ± 0.3 to −97.0 ± 0.4 mV (n= 6, P < 0.01) with no change in the maximal conductance. E, Left, Bac effects on Ih were occluded when 5–10 μM 8Br-cAMP were present in the pipette solution. Right, pooled data illustrating the Bac-induced decrease in Ih in control (74.6 ± 3.3% of control amplitude, n= 15, P < 0.02) and with 8Br-cAMP present in the pipette (93.8 ± 3.1% of control, n= 6, P > 0.05). F, pooled data illustrating the effects of bath application of IBMX (filled columns) on the amplitude of Ih in control (117.8 ± 8.8%, n= 10, P < 0.001) and during preceding exposure to Bac (105.1 ± 5.3% of control, n= 9, *P < 0.05 compared to values in control) and of uncaging cAMP (open columns) on the amplitude of Ih in control (131.1 ± 5.8% of control, n= 4, P < 0.05) and during preceding exposure to Bac (133.7 ± 9.1% of control, n= 4, P > 0.05 compared to values in control). In E and F, step voltages from −62 to −92 mV were used to evoke Ih.
Figure 2
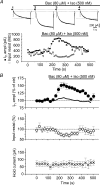
Figure 2. Co-application of Iso and Bac induces a marked potentiation of Ih
A, raw data showing the transient, strong increase in Ih upon bath application of Iso together with Bac at a concentration (80 μM) that reduced Ih when applied alone. Dotted lines are presented to facilitate comparison of instantaneous and h-current amplitudes between the four traces. The time course of the potentiation is illustrated at the bottom (•), together with the input resistance of the neurone (○). The data points deduced from the traces presented at the top (1–4) are indicated in the plot. B, pooled data from six cells illustrating the time course of the potentiation (top panel), of the input resistance (middle panel) and the holding current (lower panel). The thick line in the top panel depicts the linear sum of the effects of Iso and Bac illustrated in Fig. 1.
Figure 3
Figure 3. The potentiation of Ih by coapplication of Iso and Bac is associated with a strong positive shift in the activation curve with no change in maximal conductance
A, top, family of h-currents during control (left) and in the presence of Iso and Bac (right). Note the pronounced increase in current amplitude at intermediately hyperpolarized potentials. A, bottom, graph of h-current amplitudes as a function of test potential in control (○) and in the presence of Iso and Bac (•). Maximal current amplitudes are not changed by Iso and Bac (−1701 ± 181 pA in control versus−1786 ± 207 pA in Iso + Bac, n= 6, P >0.05). B, activation curves in control (○) and in the presence of Iso and Bac (•). All tail currents were normalized with respect to the maximal tail current under control conditions. Co-applied Iso and Bac produced an 11 mV positive shift in the activation curve (from −95.7 ± 0.7 to −84.6 ± 0.9 mV, n= 6, P < 0.05) with no change in the maximal activation of the current.
Figure 4
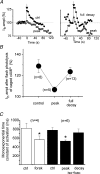
Figure 4. The potentiation of Ih by coapplication of Iso and Bac leads to a reversible occlusion of Ih modulation via photolytically released cAMP
A, data from two separate experiments showing the response to uncaged cAMP (photolysis was initiated at the time depicted by the arrow). In the experiment presented on the left, cAMP was photolytically released during control (•) and during the peak of the potentiation induced by Iso and Bac (○). In the experiment presented on the right, cAMP was photolytically released at the peak of the potentiation (○) and after its full decay (•). To facilitate comparison of the extent of the potentiation during the different periods, data were normalized to the average of the three data points preceding flash application. B, pooled data illustrating the increase in Ih amplitude following flash photolysis of caged cAMP during control (128.9 ± 6.3% of basal Ih amplitude, n= 8, P < 0.005), at the peak of the potentiation (106.6 ± 2.5% of Ih amplitude preceding the flash, n= 5, P >0.05), and after its full decay (123.6 ± 4.1% of basal Ih amplitude, n= 11, P >0.05versus increase before application of Iso and Bac). C, histogram of the time constants of activation of Ih during exposure to Forsk (825 ± 114versus561 ± 86 ms, n= 4, *P < 0.05) and during the response to coapplication of Iso and Bac (780 ± 57 ms in control; 533 ± 23 ms at the peak, n= 6, *P < 0.01; 723 ± 82 ms during recovery, P > 0.05 compared to control).
Figure 5
Figure 5. The presence of Bac changes the time course of the cAMP transient induced by Iso
A, data from a single experiment, illustrating the time course of Ih amplitudes following focal exposure to Iso before and after bath application of Bac. Bac alone reduced Ih in this cell by 15%. Selected Ih recordings are presented in the inset (1–5). B, averaged decay time course of the potentiation of Ih by local application of Iso alone (○) and in the presence of Bac (•). Lines show the non-linear least square fit of a monoexponential curve to the data, yielding a time constant τ= 241 ± 30 s for Iso + Bac versusτ= 32 ± 6 s for Iso (n= 4, P < 0.005). C and D, same experiment as in A and B, but with Bac applied at 0.8 μM. Note that the decay time course was further decelerated by low concentrations of Bac, such that monoexponential fitting was not possible.
Figure 6
Figure 6. Pharmacological characterization of the up-regulation
A, the natural transmitter for GABAB receptors, GABA, induced a potentiation of Iso responses in the presence of picrotoxin (100 μM). The graph illustrated the time course of Ih amplitudes in a single experiment. Selected Ih recordings are presented in the inset. B, the modulation of Ih by Iso remained unaltered in the presence of Bac (0.8 μM), when NEM (120 μM) was preapplied for 2 min. Time course of Ih amplitudes in a representative experiment. Selected Ih recordings are presented in the inset (1–5). C, average time course of decay of Iso-induced modulation of Ih before (○, τ= 47 ± 16 s, n= 4) and after (•, τ= 90 ± 43 s, n= 4, P >0.05) application of Bac in the presence of NEM. D, histogram summarizing the effects of different combinations of agonists for GPCRs. The responses to Iso were potentiated in the presence of GABA (1 mM) and picrotoxin (PTX, 100 μM) (183.6 ± 11.4%versus 145.8 ± 9.4% of control in 5 of 7 cells tested, *P < 0.05), but not in the presence of CPA (50 μM) (146.4 ± 16.4%versus143.0 ± 8.3% of control, n= 3, P > 0.05), an A1 agonist. DAMGO (1 μM), a μ-opioid receptor agonist, increased Ih in the absence of Iso to 148.0 ± 16.1% of control (n= 4, P < 0.02).
Figure 7
Figure 7. Examination of the role of synaptic GABAB receptors in the potentiation of Ih responses by Iso
A, CGP 54626-sensitive outward currents elicited by stimulation of afferent nRt fibers via bipolar tungsten electrodes (300–700 μA, 100 μs). B, in a different cell, representative Ih responses were monitored under control conditions (ctrl) and after Iso was applied with (+ stim and + Iso) and without (+ Iso) concomitant activation of GABAB receptors (10 stimuli at 5 Hz). Overlay shows control Ih, the current response to application of Iso alone, and the response following conjoint Iso application and electrical stimulation. During this experiment, Ba2+ ions (1.5 mM) were present to prevent activation of outward K+ currents. C, averaged data for seven experiments, indicating a significant increase in the Iso sensitivity of Ih amplitude after electrical stimulation (arrow, 118.5 ± 4.3% of control Ih amplitude during Iso application; 140.2 ± 12.0% of Ih amplitude during Iso application and coactivation of GABAB receptors, n= 7, P < 0.05). (○, control responses; •, responses with GABAB receptor activation.)

References

    1. Accili EA, Redaelli G, DiFrancesco D. Differential control of the hyperpolarization-activated current (if) by cAMP gating and phosphatase inhibition in rabbit sino-atrial node myocytes. J Physiol. 1997;500:643–651. - PMC - PubMed
    1. Andrade R. Enhancement of β-adrenergic responses by Gi-linked receptors in rat hippocampus. Neuron. 1993;10:83–88. - PubMed
    1. Anholt RRH. Signal integration in the nervous system: adenylate cyclases as molecular coincidence detectors. Trends Neurosci. 1994;17:37–41. - PubMed
    1. Aston-Jones G, Bloom FE. Activity of norepinephrine-containing locus coeruleus neurons in behaving rats anticipates fluctuations in the sleep-waking cycle. J Neurosci. 1981;1:876–886. - PMC - PubMed
    1. Bacskai BJ, Hochner B, Mahaut-Smith M, Adams SR, Kaang BK, Kandel ER, Tsien RY. Spatially resolved dynamics of cAMP and protein kinase A subunits in Aplysia sensory neurons. Science. 1993;260:222–226. - PubMed

Publication types

MeSH terms

LinkOut - more resources