. 2004 Jan 1;554(Pt 1):145-55.
doi: 10.1113/jphysiol.2003.053314.

Calmodulin kinase is functionally targeted to the action potential plateau for regulation of L-type Ca2+ current in rabbit cardiomyocytes

Affiliations

Calmodulin kinase is functionally targeted to the action potential plateau for regulation of L-type Ca2+ current in rabbit cardiomyocytes

Yuejin Wu et al. J Physiol. .

Abstract

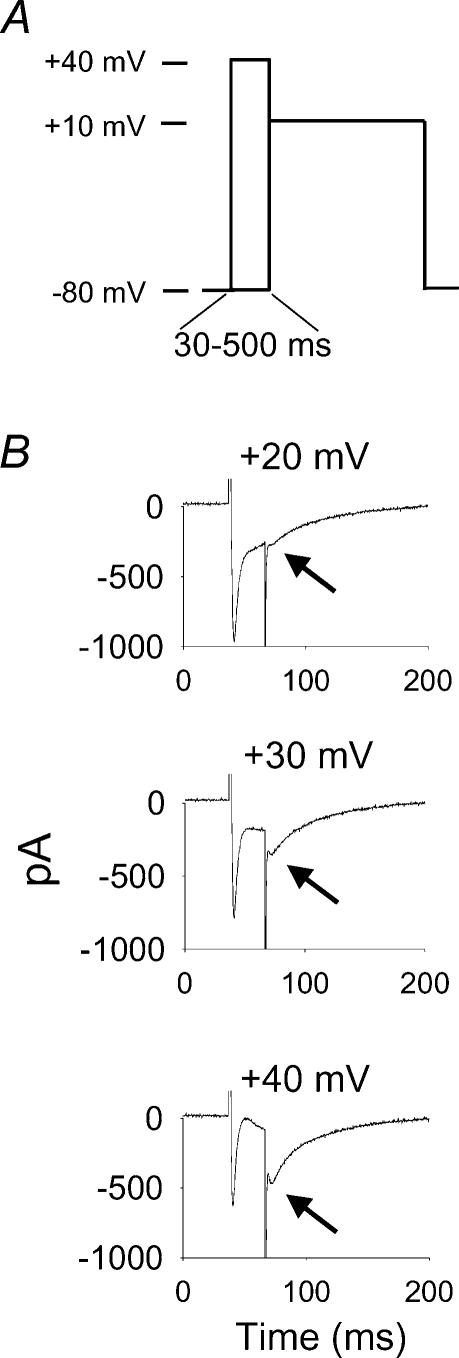
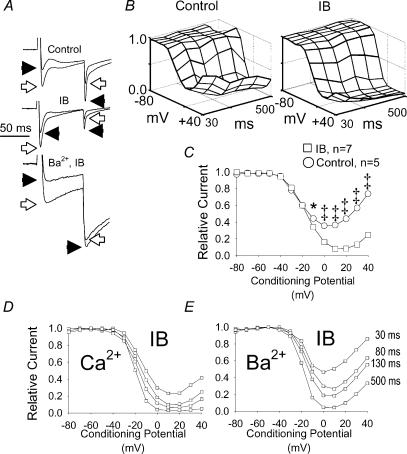
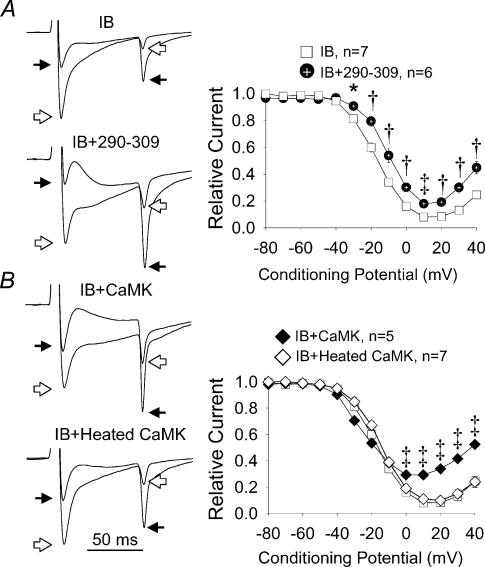
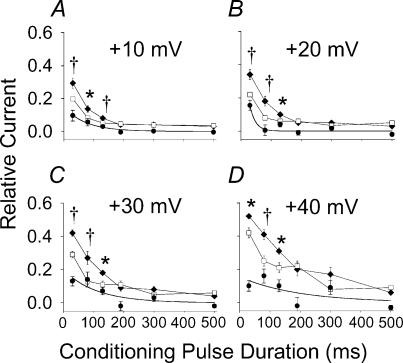
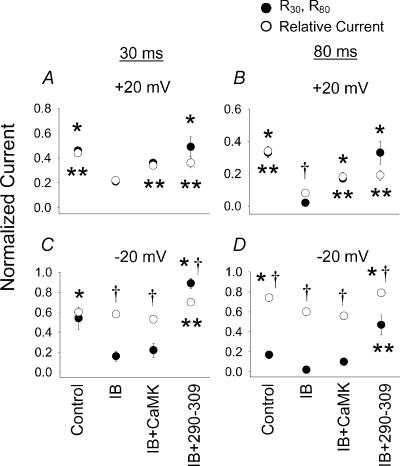
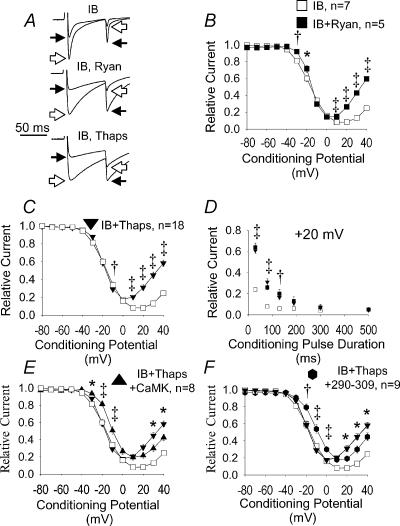
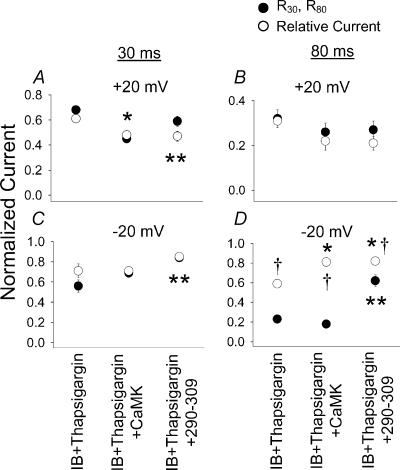
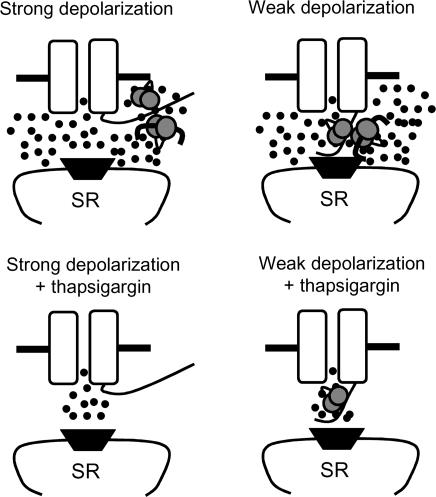
L-type Ca2+ current (ICa-L) triggers Ca2+ release from the sarcoplasmic reticulum (SR) and both SR and ICa-L are potential sources of intracellular Ca2+ (Ca2+i) for feedback regulation of ICa-L. Ca2+i bound to calmodulin (Ca2+-CaM) can inhibit ICa-L, while Ca2+-CaM can also activate Ca2+-CaM-dependent protein kinase II (CaMK) to increase ICa. However, it is not known whether ICa-L or the SR is the primary source of Ca2+ for ICa-L regulation. The L-type Ca2+ channel C terminus is implicated as a critical transduction element for ICa-L responses to Ca2+-CaM and CaMK, and the C terminus undergoes voltage-dependent steric changes, suggesting that Ca2+i control of ICa-L may also be regulated by cell membrane potential. We developed conditions to separately test the relationship of Ca2+-CaM and CaMK to ICa-L and SR Ca2+i release during voltage clamp conditions modelled upon time and voltage domains relevant to the cardiac action potential. Here we show that CaMK increases ICa-L after brief positive conditioning pulses, whereas Ca2+-CaM reduces ICa-L over a broad range of positive and negative conditioning potentials. SR Ca2+ release was required for both Ca2+-CaM and CaMK ICa-L responses after strongly positive conditioning pulses (+10 and +40 mV), while Ca2+i from ICa-L was sufficient for Ca2+-CaM during weaker depolarizations. These findings show that ICa-L responses to CaMK are voltage dependent and suggest a new model of L-type Ca2+ channel regulation where voltage-dependent changes control ICa-L responses to Ca2+-CaM and CaMK signalling.


Figures

Figure 1
Figure 1. Non-steady-state inactivation voltage clamp protocol reveals increases in relative L-type Ca2+ current (ICa−L) after brief, positive conditioning steps
A, a schematic representation of the voltage clamp protocol used for this study. Peak ICa−L was measured at a +10 mV test pulse, after conditioning steps from –80 to +40 mV in 10 mV steps, lasting from 30 to 500 ms. B, conditioning steps (30 ms) from +20 to +40 mV progressively increase available ICa−L at the test pulse of +10 mV (indicated by arrows). The conditioning prepulse potential is labelled above each panel. A transient outward Ca2+-activated Cl current is superimposed on ICa−L during some conditioning steps positive to +10 mV (see Methods for details) (Wu et al. 1999b).
Figure 2
Figure 2. A CaMK inhibitory buffer (IB) reduces ICa−L at action potential plateau potentials
A, current tracings recorded in control pipette solution with Ca2+ as charge carrier (Control), IB pipette solution with Ca2+ as charge carrier (IB) and IB pipette solution with Ba2+ as charge carrier (Ba2+, IB) are shown. Currents in response to +20 mV (open arrows) and +30 mV (filled arrow heads) conditioning prepulses are superimposed and normalized to the peak ICa−L at +20 mV for comparison. B, topology plots showing the combined effects of conditioning prepulse potentials (–80 to +40 mV) and conditioning prepulse durations (30–500 ms) on relative peak Ca2+ current (ICa) recorded during the test potential step to +10 mV in cells (n= 3 for each group) dialysed with control solution (Control) or IB solution (IB). The grid lines on the topology plots indicate conditioning potentials in +10 mV increments (evenly spaced from –80 to +40 mV) and conditioning prepulse durations (evenly spaced at 30, 80, 130, 190, 300 and 500 ms). C, peak ICa−L after 80 ms conditioning prepulses from –80 to +40 mV (abscissa) in cells dialysed with control buffer (n= 5) that permits activation of endogenous CaMK and with IB (n= 7, see Methods for details) that prevents activation of endogenous CaMK. This IB data set is also used in Figs 3–6 and this Control data set is used in Figs 4 and 5 for other comparisons. D and E show a family of non-steady-state inactivation relationships for a single cardiomyocyte dialysed with IB using (D) Ca2+ or (E) Ba2+ as charge carrier. The duration of the conditioning prepulse is indicated for each of the isochrones in C and D. Peak ICa−L is normalized to the maximum value in all panels. *P < 0.05, P < 0.001.
Figure 3
Figure 3. The effects of Ca2+–CaM and CaMK on ICa−L
A, the left panels show superimposed current tracings (as in Fig. 2A) in response to conditioning prepulses to +20 mV (open arrows) and +40 mV (filled arrows) in cells dialysed with IB (IB) or a combination of IB and the Ca2+–CaM inhibitory peptide 290–309 (IB + 290–309). The right panel shows summary findings for peak ICa−L after 80 ms conditioning prepulses from –80 to +40 mV (abscissa) in cells treated as described in the left panels. B, the left panels show superimposed current tracings labelled as in A (above), but these cells were dialysed with IB and a Ca2+-independent form of CaMK (IB + CaMK) or IB and heat-inactivated CaMK (IB + heated CaMK). The right panel shows summary findings for peak ICa−L (as in A), but from cells treated as in the left panels. Dialysis with a Ca2+–CaM-independent form of CaMK that is resistant to IB increases relative ICa−L (80 ms prepulses) compared to IB alone after positive conditioning pulses. CaMK activity is ablated by heat inactivation and peak ICa−L is normalized to the maximum value. *P < 0.05, P < 0.01, P < 0.001 for A and B.
Figure 4
Figure 4. The effect of exogenous Ca2+–CaM-independent CaMK on ICa−L availability after positive conditioning prepulses
A–D, each shows peak ICa−L responses to conditioning prepulses of varying durations (abscissa) at four positive membrane potentials (indicated above each plot). Cells were dialysed with IB to inhibit endogenous CaMK activity in the presence (filled diamonds, n= 5) or absence (open squares, n= 7) of Ca2+-independent CaMK that is resistant to IB. Filled circles represent the difference in relative ICa−L in IB + CaMK and IB alone and the contiuous lines are exponential fits of these differences. *P < 0.05, P < 0.01.
Figure 5
Figure 5. The effect of CaMK on relative and residual ICa−L
The effect of CaMK on relative ICa−L (recorded during test pulses to +10 mV as in Fig. 1, shown as open circles) after conditioning prepulses to +20 mV (A and B) and –20 mV (C and D) and the residual ICa−L at the end of 30 ms (R30, A and C) and 80 ms (R80, B and D) conditioning prepulses (filled circles). The experimental pipette solutions are labelled below C and D, but are also valid for A and B. Cells were dialysed with control pipette solution (Control), IB solution (IB), IB containing a Ca2+-independent form of CaMK (IB + CaMK) or IB containing the CaM binding peptide 290–309 (IB + 290–309) and all data are from Figs 2 and 3. Significant differences in residual current (R30 and R80, *P < 0.05) or relative current (**P < 0.05) between the IB condition and Control, IB + CaMK or IB + 290–309 are indicated. Significant differences between residual currents and relative current measurements for each experimental condition are shown (P < 0.05).
Figure 6
Figure 6. CaM and CaMK require SR Cai2+ after positive conditioning pulses
A, superimposed current tracings displayed as in Fig. 3A. Cells were dialysed with IB in all panels (IB), but ryanodine (IB, Ryan) or thapsigargin (IB, Thaps) were added to the bath solution to inactivate SR Ca2+ release in some experiments. Both ryanodine (B, Ryan) and thapsigargin (C, Thaps) significantly increased available ICa−L after 80 ms conditioning prepulses in cells dialysed with IB to inhibit endogenous CaMK. Pre-pulse potentials (abscissa) are plotted against peak ICa−L normalized to the maximum value (ordinate). D, normalized peak ICa−L values from B and C are plotted against conditioning prepulses to +20 mV for a range of prepulse durations (abscissa). No significant differences in peak ICa−L were present between ryanodine- and thapsigargin-treated cells. *P < 0.05, P < 0.01 and P < 0.001 for panels B–D. E, addition of Ca2+-independent CaMK failed to increase relative ICa−L in cells dialysed with IB and treated with thapsigargin after positive conditioning prepulses (IB + CaMK + Thaps). F, the Ca2+–CaM inhibitory peptide 290–309 failed to increase relative ICa−L in cells dialysed with IB and treated with thapsigargin (IB + Thaps + 290–309) after positive conditioning prepulses. P < 0.001, P < 0.01, *P < 0.05 for comparisons in panels E and F.
Figure 7
Figure 7. The effect of CaMK and Ca2+–CaM on relative ICa−L and R30 and R80 in cells treated with thapsigargin
The data are displayed as in Fig. 5 except thapsigargin was included in the bath solution and cells were dialysed with IB (IB + thapsigargin), IB and Ca2+-independent CaMK (IB + thapsigargin + CaMK) or the Ca2+–CaM inhibitory peptide 290–309 (IB + thapsigargin + 290–309). The experimental conditions are labelled below C and D, but are also valid for A and B. The data sets were previously displayed for relative current in Fig. 6E and F. Significant differences between the IB + thapsigargin and other groups for residual current (R30 and R80, *P < 0.05) and relative current (**P < 0.05) are indicated. Significant differences between residual currents and relative currents for each experimental condition are shown (P < 0.01).
Figure 8
Figure 8. Schematic depiction of the hypothesized relationship between cell membrane potential, L-type Ca2+ channel C terminus motion and Cai2+‘sensing’ by CaM and CaMK
The L-type Ca2+ channel pore forming subunit (α1C) is shown as a pair of open rectangles with a central pore. The C terminus protrudes into the cytoplasmic space from the right rectangle and the pore region and SR Ca2+ release channel (ryanodine receptor, dark trapezoid) are en face. Ca2+–CaM is depicted as a pair of stippled circles linked by a curved segment and activated CaMK is shown as a thick bar with curved ends bound to Ca2+–CaM. According to the hypothesized model, strong depolarizations motivate the C terminus to move away from the α1C pore so that Cai2+ sensing is primarily from the SR. Weak depolarizations leave the C terminus in the vicinity of the pore where sensed Cai2+ is directly from ICa−L. Inactivation of SR Ca2+ release (by thapsigargin) results in significant impairment of Cai2+ sensing through CaM and CaMK during strong depolarizations, while Cai2+ from ICa−L is sufficient for Ca2+–CaM at weak depolarizations in the absence of SR Ca2+ release.

Similar articles

Cited by

References

    1. Alseikhan BA, DeMaria CD, Colecraft HM, Yue DT. Engineered calmodulins reveal the unexpected eminence of Ca2+ channel inactivation in controlling heart excitation. Proc Natl Acad Sci U S A. 2002;99:17185–17190. - PMC - PubMed
    1. Balke CW, Wier WG. Ryanodine does not affect calcium current in guinea pig ventricular myocytes in which Ca2+ is buffered. Circ Res. 1991;68:897–902. - PubMed
    1. Balshaw DM, Xu L, Yamaguchi N, Pasek DA, Meissner G. Calmodulin binding and inhibition of cardiac muscle calcium release channel (ryanodine receptor) J Biol Chem. 2001;276:20144–20153. - PubMed
    1. Bartel S, Vetter D, Schlegel WP, Wallukat G, Krause EG, Karczewski P. Phosphorylation of phospholamban at threonine-17 in the absence and presence of beta-adrenergic stimulation in neonatal rat cardiomyocytes. J Mol Cell Cardiol. 2000;32:2173–2185. - PubMed
    1. Braun AP, Schulman H. A non-selective cation current activated via the multifunctional Ca(2+)–calmodulin-dependent protein kinase in human epithelial cells. J Physiol. 1995;488:37–55. - PMC - PubMed

Publication types