. 2004 Jan;186(1):164-78.
doi: 10.1128/JB.186.1.164-178.2004.

Formation and composition of the Bacillus anthracis endospore

Affiliations

Formation and composition of the Bacillus anthracis endospore

Hongbin Liu et al. J Bacteriol. 2004 Jan.

Abstract

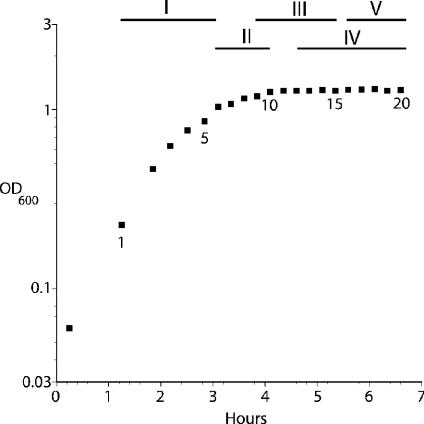
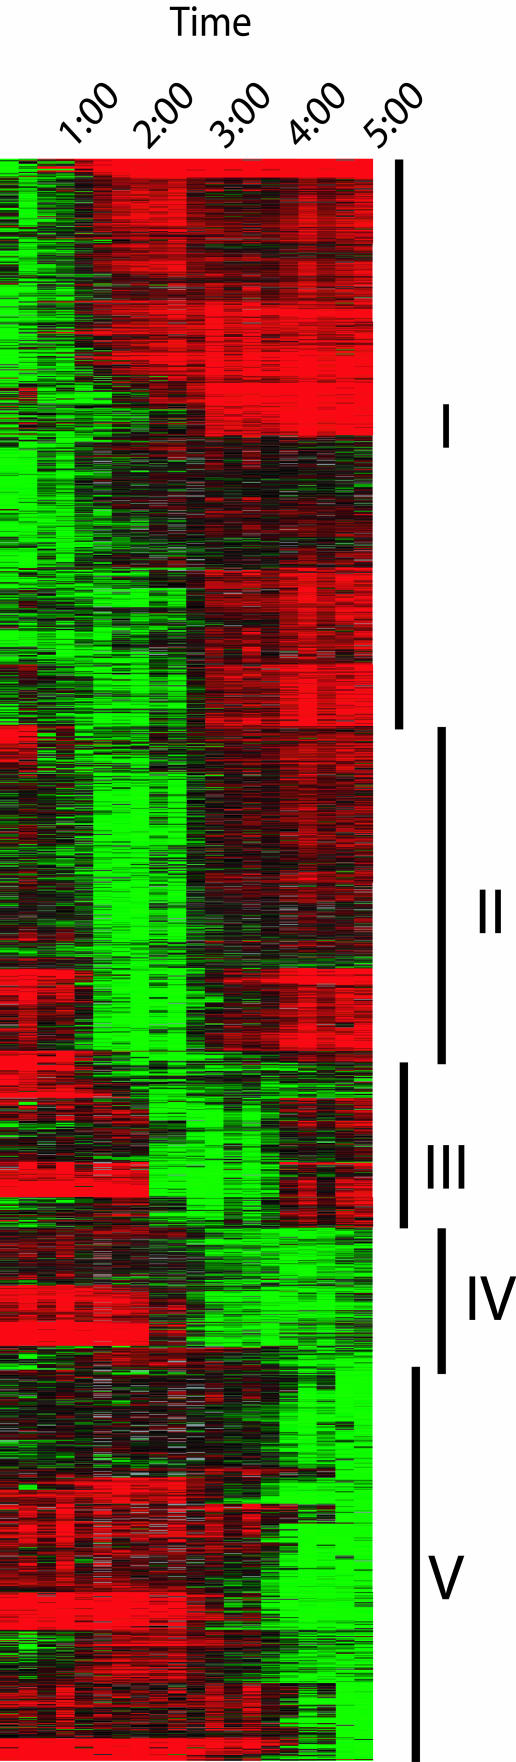
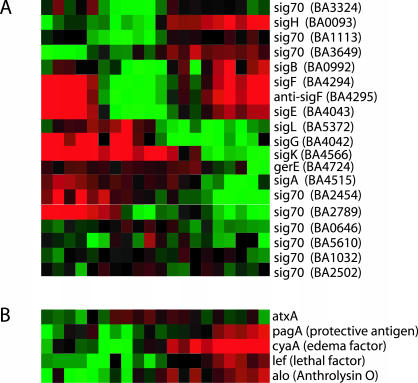
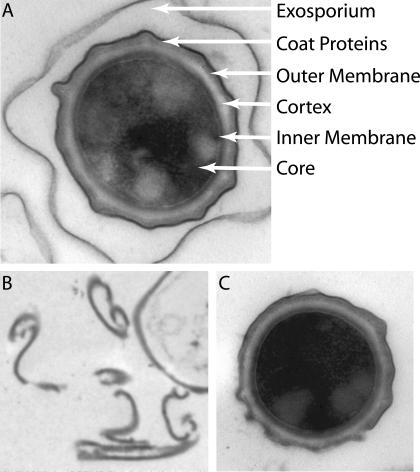
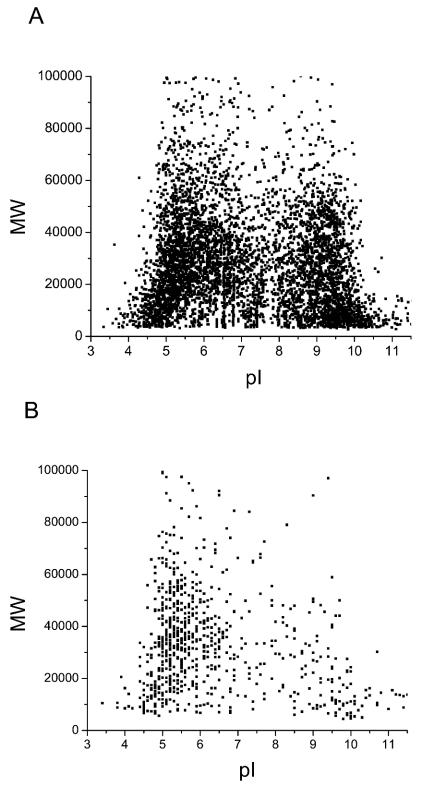
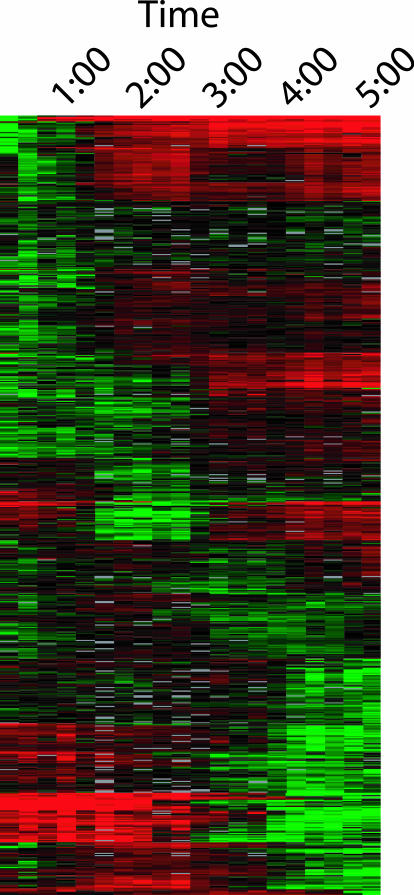
The endospores of Bacillus anthracis are the infectious particles of anthrax. Spores are dormant bacterial morphotypes able to withstand harsh environments for decades, which contributes to their ability to be formulated and dispersed as a biological weapon. We monitored gene expression in B. anthracis during growth and sporulation using full genome DNA microarrays and matched the results against a comprehensive analysis of the mature anthrax spore proteome. A large portion (approximately 36%) of the B. anthracis genome is regulated in a growth phase-dependent manner, and this regulation is marked by five distinct waves of gene expression as cells proceed from exponential growth through sporulation. The identities of more than 750 proteins present in the spore were determined by multidimensional chromatography and tandem mass spectrometry. Comparison of data sets revealed that while the genes responsible for assembly and maturation of the spore are tightly regulated in discrete stages, many of the components ultimately found in the spore are expressed throughout and even before sporulation, suggesting that gene expression during sporulation may be mainly related to the physical construction of the spore, rather than synthesis of eventual spore content. The spore also contains an assortment of specialized, but not obviously related, metabolic and protective proteins. These findings contribute to our understanding of spore formation and function and will be useful in the detection, prevention, and early treatment of anthrax. This study also highlights the complementary nature of genomic and proteomic analyses and the benefits of combining these approaches in a single study.


Figures

FIG. 1.
FIG. 1.
B. anthracis growth in modified G medium. Data points show the optical density at 600 nm (OD600) of cells at the time of cell harvesting for RNA purification (numbered 1 to 20). Bars indicate waves of gene expression described in the text and correspond to clusters shown in Fig. 2.
FIG.2.
FIG.2.
Cluster analysis of differentially expressed B. anthracis genes. The relative expression levels of 2,090 differentially expressed genes are shown (rows) for each of the 20 time points examined (columns 1 to 20, from left to right). Times shown at top are those elapsed from the first time point. Up-regulated genes are green, while down-regulated genes are red. Color intensity is proportional to the level of regulation, with the most intense shades of green and red corresponding to induction and repression, respectively, greater than eightfold. Grey indicates missing data. Bars indicate the waves of gene expression discussed in the text. Expression profiles for each time point were measured in at least two independent hybridizations.
FIG. 3.
FIG. 3.
Features of spore proteome and differentially expressed genes in relation to the entire genome of B. anthracis. Bars show the percentage of genes with transcription coaligned (i.e., in the same orientation) with the direction of replication (medium gray), the average distance from the replication origin in nucleotides (pale gray; left axis), the average percent best normalized Blastp (1) hits to B. cereus 10987 and 14579 (17, 35) (dark gray; see reference for a description of the normalized Blast method). One-tailed Student's t tests were performed to establish divergence from the experimental data sets from the mean of the whole genome; asterisks mark the significant differences (P < 0.05). Note that there was no overall bias for genes in any data set to be either to the left or to the right of the origin.
FIG. 4.
FIG. 4.
Distribution of functional categories in the five waves of gene expression during B. anthracis growth and sporulation. Pie charts indicate the fraction of each wave of expression that corresponds to each category.
FIG. 5.
FIG. 5.
Expression of specific functional families. (A) Expression of the RNA polymerase sigma factors during B. anthracis growth and sporulation. Time points at which expression is induced are green, and those at which expression is repressed are red, with the intensity of color indicating the strength of induction or repression. (B) Expression of major B. anthracis virulence factors. Data are presented as in panel A.
FIG. 6.
FIG. 6.
Transmission electron micrograph of negatively stained (2% uranyl acetate) B. anthracis endospores, including an intact spore (A), free exosporium (B), and an NS (C). Magnifications, ×92,000 (A and C) and ×13,500 (B).
FIG. 7.
FIG. 7.
Comparison of virtual two-dimensional gel diagrams of the theoretical B. anthracis genome-derived proteome (A) and MudPIT-identified spore proteins (B). The two diagrams showed similar protein distribution patterns, indicating no gross bias in protein identification using MudPIT.
FIG. 8.
FIG. 8.
Distributions of protein functional categories in the theoretical B. anthracis proteome (A) and MudPIT-identified NS proteins (B). Proteins from all 17 major functional categories except the prophage and transposon category were represented in the NS, although some were overrepresented or underrepresented relative to the theoretical total B. anthracis proteome.
FIG. 9.
FIG. 9.
Expression of genes whose products were identified as components of the B. anthracis endospore. The relative expression levels of differentially expressed genes are shown (rows) for each of the 20 time points examined (columns 1 to 20, from left to right). Times shown at top are those elapsed from the first time point. Up-regulated genes are green, while down-regulated genes are red. Color intensity is proportional to the level of regulation, with the most intense shades of green and red corresponding to induction and repression, respectively, greater than eightfold. Grey indicates missing data.

References

    1. Altschul, S. F., T. L. Madden, A. A. Schaffer, J. Zhang, Z. Zhang, W. Miller, and D. J. Lipman. 1997. Gapped BLAST and PSI-BLAST: a new generation of protein database search. Nucleic Acids Res. 25:3389-3402. - PMC - PubMed
    1. Bagyan, I., and P. Setlow. 2002. Localization of the cortex lytic enzyme CwlJ in spores of Bacillus subtilis. J. Bacteriol. 184:1219-1224. - PMC - PubMed
    1. Balassa, G., P. Milhaud, E. Raulet, M. Silva, and J. Sousa. 1979. A Bacillus subtilis mutant requiring dipicolinic acid for the development of heat-resistant spores. J. Gen. Microbiol. 110:365-379. - PubMed
    1. Bourgogne, A., M. Drysdale, S. Hilsenbeck, S. Peterson, and T. Koehler. 2003. Global effects of virulence gene regulators in a Bacillus anthracis strain with both virulence plasmids. Infect. Immun. 71:2736-2743. - PMC - PubMed
    1. Chen, Y., S. Fukuoka, and S. Makino. 2000. A novel spore peptidoglycan hydrolase of Bacillus cereus: biochemical characterization and nucleotide sequence of the corresponding gene, sleL. J. Bacteriol. 182:1499-1506. - PMC - PubMed

Publication types

MeSH terms