Review
. 2003 Oct-Nov;16(6-7):313-38.
doi: 10.1002/nbm.841.

Localized in vivo 13C NMR spectroscopy of the brain

Affiliations
Review

Localized in vivo 13C NMR spectroscopy of the brain

Rolf Gruetter et al. NMR Biomed. 2003 Oct-Nov.

Abstract

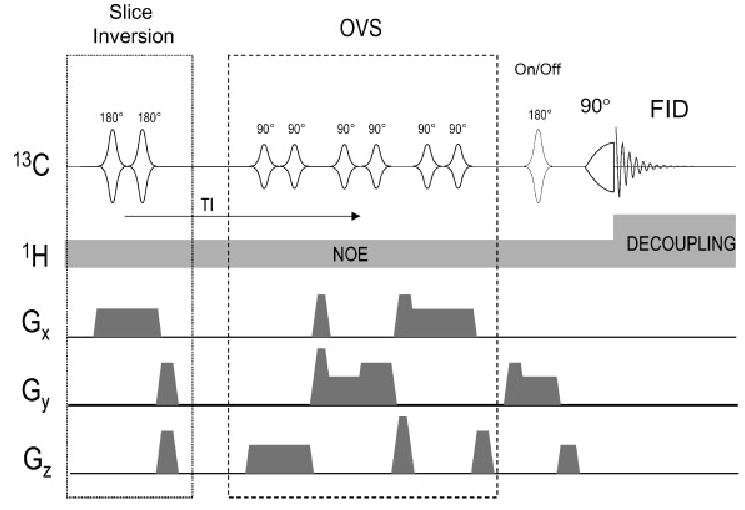
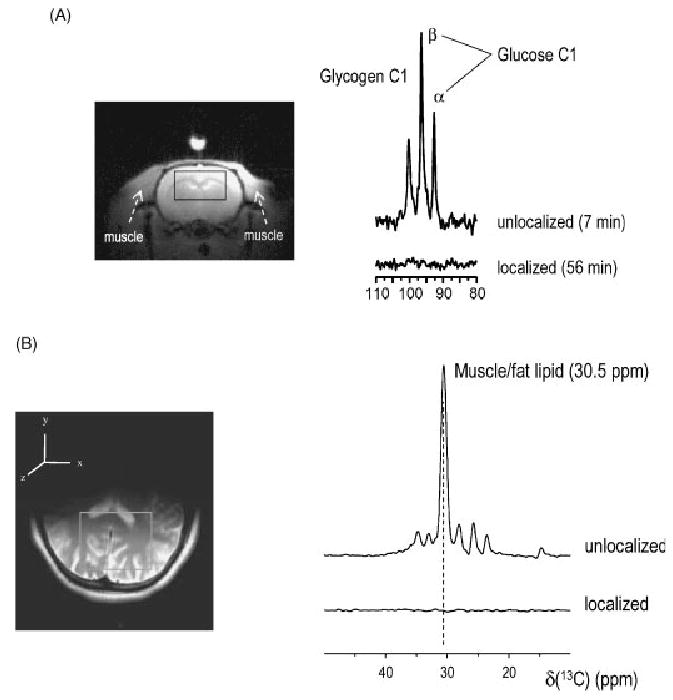
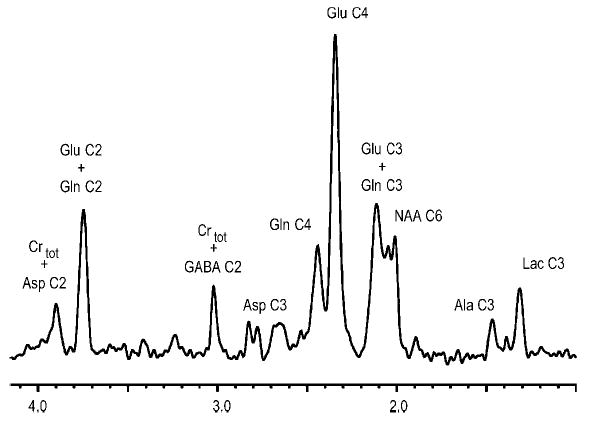
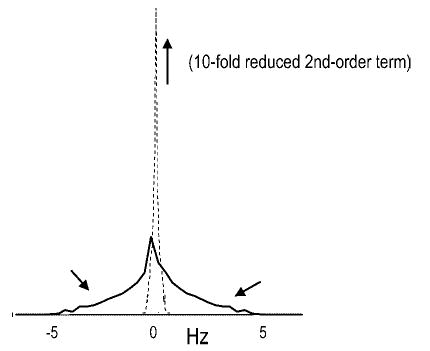
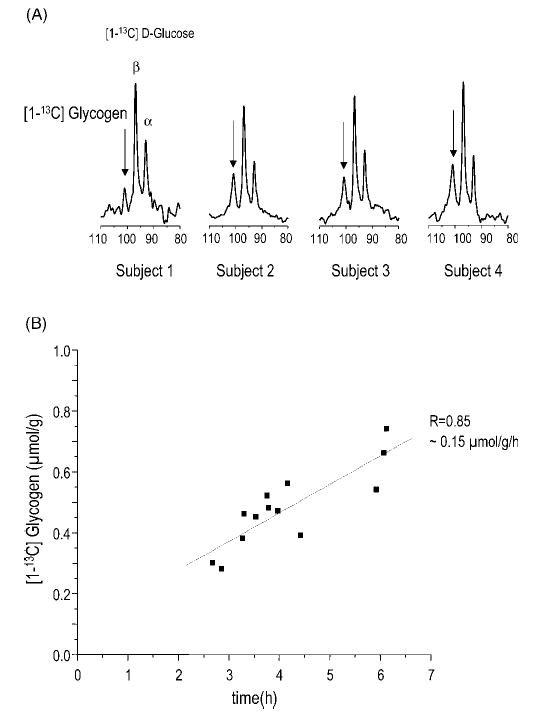
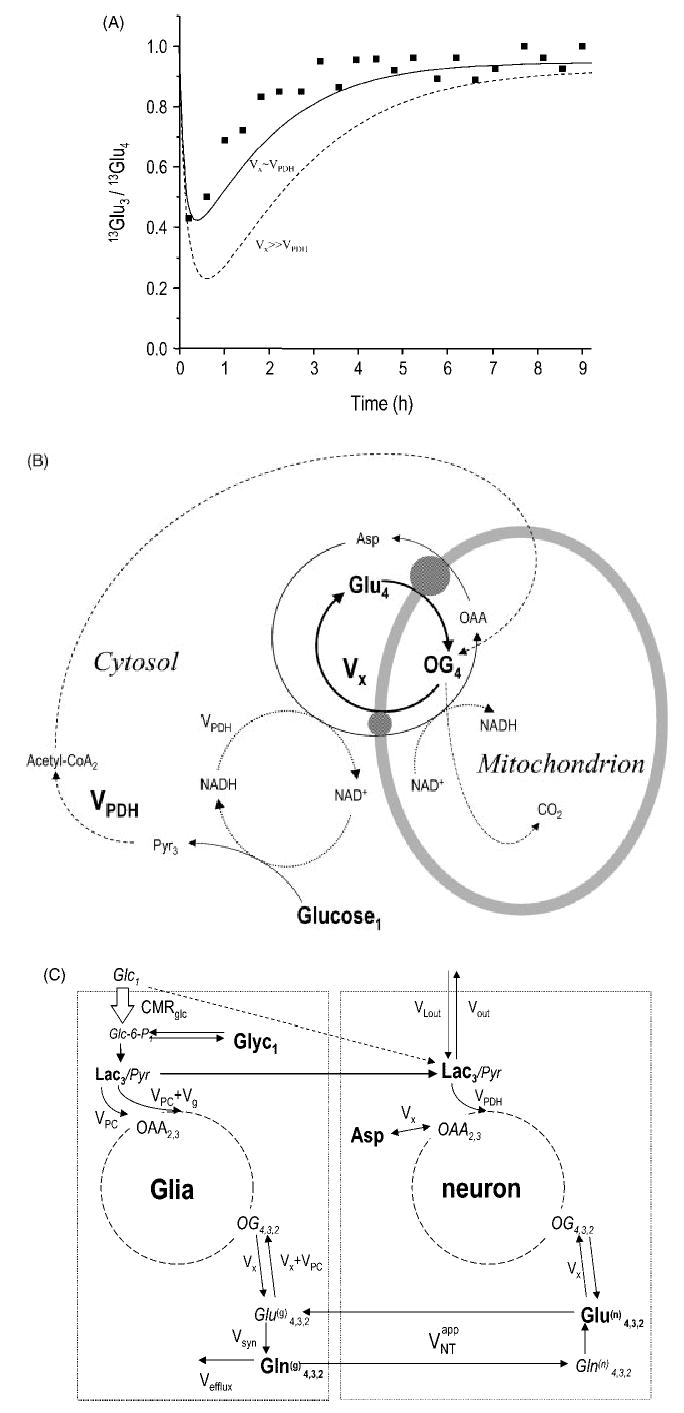
Localized (13)C NMR spectroscopy provides a new investigative tool for studying cerebral metabolism. The application of (13)C NMR spectroscopy to living intact humans and animals presents the investigator with a number of unique challenges. This review provides in the first part a tutorial insight into the ingredients required for achieving a successful implementation of localized (13)C NMR spectroscopy. The difficulties in establishing (13)C NMR are the need for decoupling of the one-bond (13)C-(1)H heteronuclear J coupling, the large chemical shift range, the low sensitivity and the need for localization of the signals. The methodological consequences of these technical problems are discussed, particularly with respect to (a) RF front-end considerations, (b) localization methods, (c) the low sensitivity, and (d) quantification methods. Lastly, some achievements of in vivo localized (13)C NMR spectroscopy of the brain are reviewed, such as: (a) the measurement of brain glutamine synthesis and the feasibility of quantifying glutamatergic action in the brain; (b) the demonstration of significant anaplerotic fluxes in the brain; (c) the demonstration of a highly regulated malate-aspartate shuttle in brain energy metabolism and isotope flux; (d) quantification of neuronal and glial energy metabolism; and (e) brain glycogen metabolism in hypoglycemia in rats and humans. We conclude that the unique and novel insights provided by (13)C NMR spectroscopy have opened many new research areas that are likely to improve the understanding of brain carbohydrate metabolism in health and disease.


Figures

Figure 1
Figure 1
Cross-sectional view of a half-volume 13C–1H coil. From Adriany and Gruetter. The 1H coil consists of two surface coil loops with distributed capacitance. The geometric arrangement of the two coils in conjunction with a quadrature hybrid generates a circularly polarized RF field over the field of view of the smaller 13C surface coil, which is placed above the intersection of the two 1H coils. The 13C coil overlaps partially with each of the 1H coils, thereby minimizing the voltage induced by the 1H coil in the 13C coil. The T1-weighted MDEFT image of a human head is shown to illustrate the excellent quality and relative homogeneity of the resulting 1H RF field
Figure 2
Figure 2
Placement of RF filters for direct-detected 13C NMR spectroscopy, adapted from Adriany and Gruetter. The filters are designed to minimize 1H RF breakthrough at the 13C (observe) channel. The 13C bandpass filter after the 13C pre-amplifier effectively renders the pre-amplifier narrow banded
Figure 3
Figure 3
Localization using a semi-adiabatic DEPT sequence including coherence elimination by gradient dephasing. From Henry et al. Localization is performed on the 1H z-magnetization using ISIS, complemented with outer volume suppression (OVS). The 1H part of the coherence generation was achieved using standard hard pulses, with the last pulse flip angle set to 45° to allow for the simultaneous detection of all CHn carbons. The two 90°–τ–180°–τ sequence was replaced by a segmented 0° BIR-4 pulse, rendering the performance of the sequence much less susceptible to the spatial variation of the 13C RF field, especially when using surface coils. The spoiling gradient (spoil) dephases unwanted coherences excited by the 1H pulses when they deviate from their nominal flip angles indicated. The delay τ is determined by the heteronuclear J coupling, JCH, which ranges in vivo from 127 to 167 Hz
Figure 4
Figure 4
Examples of direct-detected 13C NMR spectroscopy from the brain. (A) 13C NMR detection of label incorporation into mostly cytosolic amino acids at 4 T, from Gruetter et al. Shown is a representative spectrum obtained from a 45 ml volume in the human visual cortex during an infusion of 67%-enriched [1-13C]glucose. In addition, resonances resulting from homonuclear 13C–13C coupling were readily detected at the positions of all glutamate resonances (indicated by the brackets). Processing consisted of a mild Lorentz–Gauss apodization (3 Hz) and the spectrum is shown without baseline correction. (B) In vivo 13C NMR spectra from a 400 μl volume in the rat brain, acquired using the modified DEPT sequence depicted in Fig. 3 during an infusion of 70%-enriched [1,6-13C2]glucose, from Henry et al. Processing consisted of zero-filling, 2 Hz Lorentzian-to-Gaussian resolution enhancement and fast Fourier transform. No baseline correction was applied. Note the complete absence of the lipid signals over the entire spectral range. Resonance assignments are as follows: Glu C2 at 55.6 ppm; Gln C2 at 55.0 ppm; NAA C2 at 54.0 ppm; Asp C2 at 53.7 ppm; NAA C3 at 40.5 ppm; GABA C4 at 40.45 ppm; Asp C3 at 37.6 ppm; GABA C2 at 35.3 ppm; Glu C4 at 34.2 ppm; Gln C4 at 31.7 ppm; Glu C3 at 28.0 ppm; Gln C3 at 27.7 ppm
Figure 5
Figure 5
Localization of 13C NMR spectroscopy using OVS only, from Choi et al. The localization of the magnetization starts with two adiabatic pulses that invert the z-magnetization in slabs along x adjacent to the voxel. This inverted z-magnetization approaches zero during the delay TI and when it is approximately minimized, a standard OVS sequence along all three dimensions with nominal 90° flip angles applied. Just before the adiabatic excitation pulse, an optional inversion pulse is applied on alternate scans, which together with the concomitant y-gradient and appropriate phase cycling selects a slice along y (parallel to the 13C coil plane) as in one-dimensional ISIS. Reproduced with permission from Mag. Reson. Med. Copyright © 2000 John Wiley & Sons, Ltd.
Figure 6
Figure 6
Validation of the localization of 13C NMR signals using OVS (Fig. 5). (A) Twenty minutes after termination by KCl injection, glucose and glycogen resonances from extracerebral tissue are still observed in the post-mortem rat (top), whereas upon application of the three-dimensional localization method these signals were reduced to the noise level (bottom trace). Reproduced with permission from Choi et al. (B) In the human brain, where such post-mortem studies are not applicable, the efficiency of the adapted sequence was verified from the more than 100-fold suppression of the superficial lipid signals. From Oz et al. Copyright © 2003, with permission from Elsevier
Figure 7
Figure 7
Illustration of the information content achievable in vivo by 1H-detected 13C NMR at 9.4 T. The 1H NMR spectrum was obtained from a 130 μl volume in the rat brain in the first 1 h of glucose infusion showing resonances coupled to 13C only, from Pfeuffer et al. The improved sensitivity allowed the detection of label incorporation into alanine C3 (Ala). Natural abundance signal is detected for creatine (Crtot) and NAA. Reprinted from Magn. Reson. Med. Copyright © 1999 John Wiley & Sons, Ltd.
Figure 8
Figure 8
Effect of shimming on lineshape and width. Shown is the effect of a second-order shim coil (yz) on the field distribution in a cubic volume. Upon elimination of this term (by shimming), the intensity in the wings is moved underneath the central peak indicated by the arrows, thereby increasing sensitivity and reducing potential quantification errors
Figure 9
Figure 9
Scheme of the external reference method. The in vivo experiment is scaled by the reference intensity from, for example, 99% 13C-formic acid (FA) placed at the 13C coil center to correct for differences of the effect of sample loading between the in vivo and the reference experiment. The signals are further corrected by the correction factor CF that takes into account the relaxation effects on the signal (T1, T2 and NOE) in vivo, CFin vivo, and in the phantom, CFref, to yield the corrected signal intensity Icorr. From the known concentration in the phantom the in vivo concentration can be determined, as follows: [Cin vivo]=[Cref]Iin vivoCFin vivoFAin vivoFArefIref CFref
Figure 10
Figure 10
Localized 13C NMR detection of natural abundance resonances in the human brain. The glucose resonances detected during hyperglycemia are indicated by the vertical dashed lines and identified by the comparison with the glucose phantom (bottom trace). In addition to glucose and myo-inositol, resonances from glutamate, glutamine and N-acetyl-aspartate were also discernible. From Gruetter et al.
Figure 11
Figure 11
Brain glucose transport kinetics from the measurement of the brain glucose content as a function of plasma glucose concentration. (A) Demonstration of a linear relationship between brain and plasma glucose concentrations, as well as the effect of increased anesthesia (decreased electrical activity) on brain glucose content in vivo. From Choi et al. (B) Comparison of 13C NMR quantification with 1H NMR quantification of brain glucose concentrations during hypoglycemia. From Choi et al.
Figure 12
Figure 12
Brain glycogen metabolism in the rat. (A) Time-course of glycogen C1 and glucose C1 before, during and after hypoglycemia, which was induced by administering insulin, starting at the point indicated by the arrow. During hypoglycemia, plasma glucose concentration was below 2 mm for 2 h. The vertical dotted line indicates the start of glycogenolysis during hypoglycemia, which coincided with the time point where brain glucose approached zero. The dashed line highlights the slow rate of glycogenolysis during hypoglycemia, expressed as percentages of the pre-hypoglycemic glycogen C1. From Choi et al. Reprinted from J. Neurosci. Res. Copyright © John Wiley & Sons, Ltd. (B) Label incorporation into glycogen and glucose C1, as well as several metabolites was observed in a 13C NMR spectrum acquired from a rat brain after 99% enriched [1-13C] glucose had been administered for over 48 h ad libitum. Processing consisted of 10 Hz line-broadening and zero-filling prior to Fourier transformation. The spectrum is shown without baseline correction. (C) Comparison between label incorporation into brain glycogen C1 and NAA C6 (solid circles) indicating slow turnover of brain glycogen in the awake rat. The solid line indicates the result of linear regression (r = 0.93, p < 0.01, n = 6). From this relationship, total brain glycogen content was estimated at 3.3 μmol glucosyl units/g wet weight. (B) and (C) are from Choi et al. Reprinted from Neurochem. Int. Copyright © 2003, with permission from Elsevier
Figure 13
Figure 13
Measurement of glycogen in the human brain. (A) Demonstrates the detection of the brain glycogen signal in four different subjects (arrows) along with the glucose C1 resonances. Shown is the spectral region containing the glycogen C1 and glucose C1 resonances. (B) The increase in the quantified glycogen C1 signal represents the accumulation of [1-13C] glycogen, which occurred at an extremely slow rate on the order of 0.15 μmol/g/h in the human brain, as illustrated in the graph containing measurements from three different studies. From Oz et al. Reprinted from Neurochem. Int. Copyright © 2003, with permission from Elsevier
Figure 14
Figure 14
Modeling of cerebral neurotransmitter and amino acid metabolism labeling from glucose. (A) Direct experimental evidence of a slow exchange between 2-oxoglutarate and glutamate in vivo by comparing the rate of labeling for the C3 and the C4 of glutamate. The solid line indicates calculation using the parameters from Choi et al. The dashed line was calculated after fitting to the 13Glu4(t) and 13Gln4(t) data only, which resulted in VPDH = 0.15 μmol/g/min when assuming Vx = 57 μmol/g/min, as in Sibson et al., but this was clearly inconsistent with the relative rate of labeling of the C3 resonance in glutamate. (B) The link between oxidative glucose consumption and glutamate labeling is established by active exchange between 2-oxoglutarate (OG) and glutamate (Glu), this flux is indicated by Vx. This exchange, as well as that between oxaloacetate and aspartate, is mediated by the malate-aspartate shuttle. In short, the NADH produced by oxidative metabolism of pyruvate at the rate VPDH must be recycled. This is accomplished by the malate-aspartate shuttle, which transports reducing equivalents produced from the cytosol to the mitochondrion, indicated by the fluxes. The solid lines indicate the isotope flow between the TCA cycle and the cytosolic amino acids, the dashed lines the oxidative metabolism of pyruvate, the dotted lines the NADH/NAD+ redox reaction, and the subscripts the flow of label from glucose C1 (or C6) to glutamate. (C) A mathematical model of compartmentalized brain metabolism, from Gruetter et al. Reprinted from Neurochem. Int. Copyright ©2003, with permission from Elsevier. The glial compartment is on the left and the neuronal on the right. Abbreviations for metabolic fluxes: Vg + VPC, glial pyruvate dehydrogenase flux; Vefflux, loss of Gln from the glial compartment; Vout, VLout, label dilution and exchange of lactate across the blood–brain barrier. The metabolites in bold are the signals measurable by NMR in vivo. The subscripted numerals indicate the positions labeled due to metabolism of glucose labeled at the C1 position, i.e. Glc1

Similar articles

Cited by

References

    1. Chance EM, Seeholzer SH, Kobayashi K, Williamson JR. Mathematical analysis of isotope labeling in the citric acid cycle with applications to 13C NMR studies in perfused rat hearts. . J Biol Chem. 1983;258:13785–13794. - PubMed
    1. Malloy C, Sherry A, Jeffrey F. Analysis of tricarboxylic acid cycle of the heart using 13C isotope isomers. . Am J Physiol. 1990;259:H987–H995. - PubMed
    1. Weiss RG, Stern MD, de Albuquerque CP, Vandegaer K, Chacko VP, Gerstenblith G. Consequences of altered aspartate amino-transferase activity on 13C-glutamate labelling by the tricarboxylic acid cycle in intact rat hearts. . Biochim Biophys Acta. 1995;1243:543–548. - PubMed
    1. Yu X, Alpert NM, Lewandowski ED. Modeling enrichment kinetics from dynamic 13C NMR spectra: theoretical analysis and practical considerations. . Am J Physiol. 1997;41:C2037–C2048. - PubMed
    1. van Zijl PCM, Rothman D. NMR studies of brain C-13-glucose uptake and metabolism—present status. . Magn Reson Imag. 1995;13:1213–1221. - PubMed

Publication types

LinkOut - more resources