. 2004 Jan;131(2):401-11.
doi: 10.1242/dev.00944. Epub 2003 Dec 17.

Both cyclin B levels and DNA-replication checkpoint control the early embryonic mitoses in Drosophila

Affiliations

Both cyclin B levels and DNA-replication checkpoint control the early embryonic mitoses in Drosophila

Jun-Yuan Ji et al. Development. 2004 Jan.

Abstract

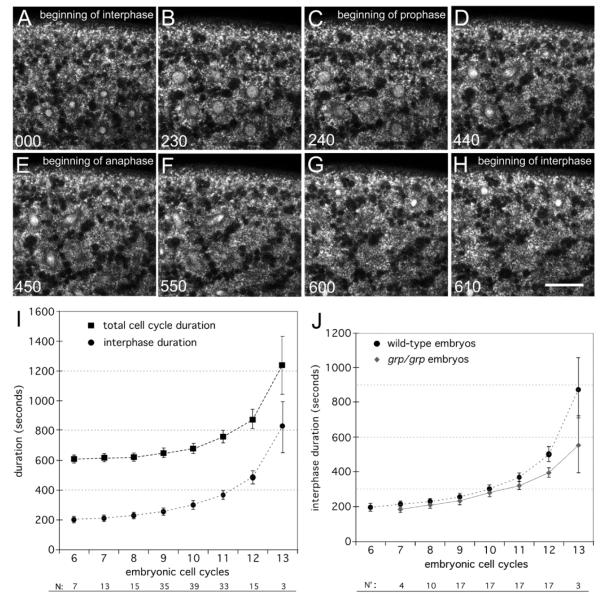
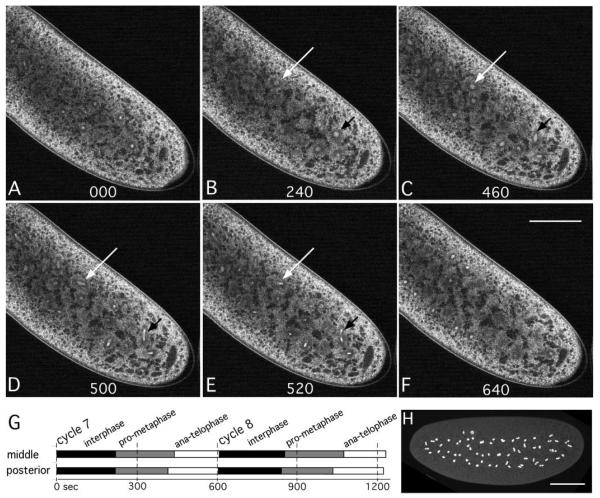
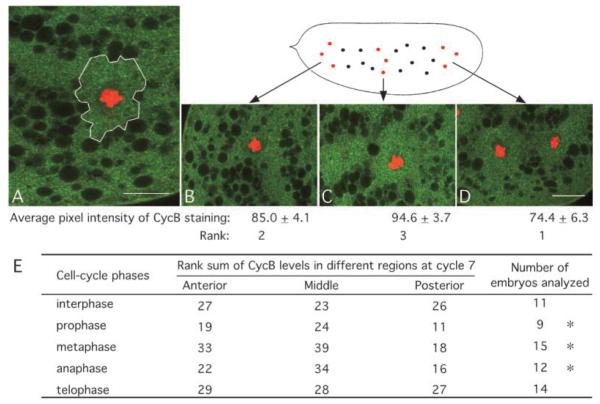
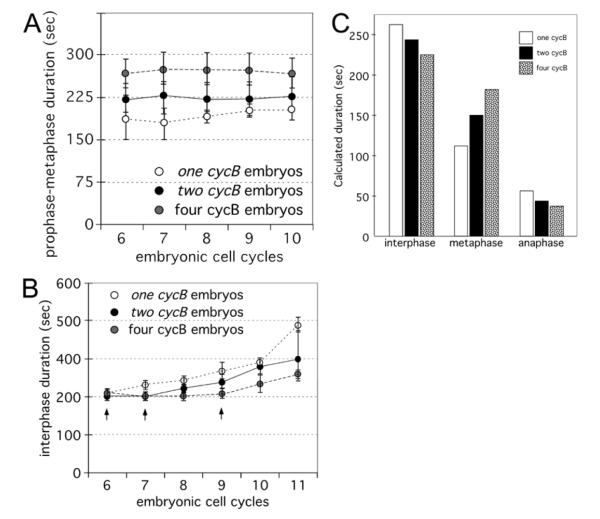
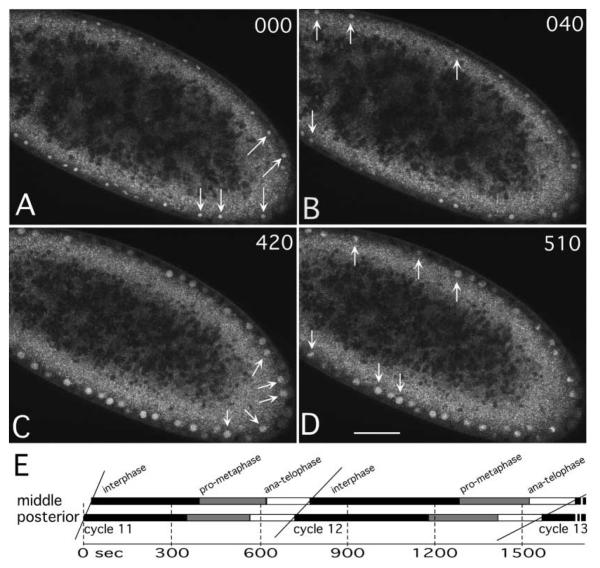
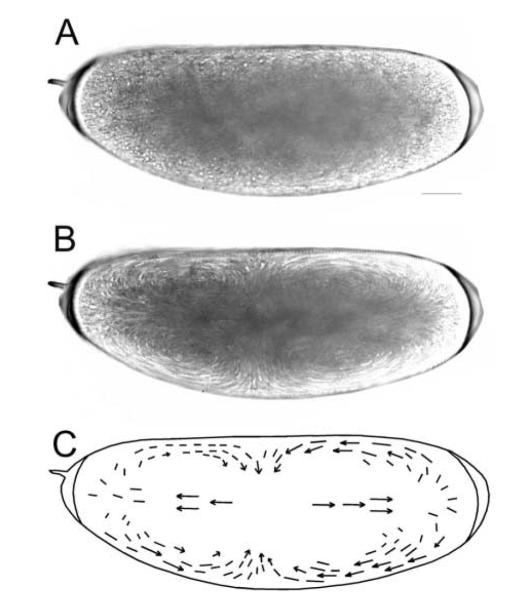
The earliest embryonic mitoses in Drosophila, as in other animals except mammals, are viewed as synchronous and of equal duration. However, we observed that total cell-cycle length steadily increases after cycle 7, solely owing to the extension of interphase. Between cycle 7 and cycle 10, this extension is DNA-replication checkpoint independent, but correlates with the onset of Cyclin B oscillation. In addition, nuclei in the middle of embryos have longer metaphase and shorter anaphase than nuclei at the two polar regions. Interestingly, sister chromatids move faster in anaphase in the middle than the posterior region. These regional differences correlate with local differences in Cyclin B concentration. After cycle 10, interphase and total cycle duration of nuclei in the middle of the embryo are longer than at the poles. Because interphase also extends in checkpoint mutant (grapes) embryo after cycle 10, although less dramatic than wild-type embryos, interphase extension after cycle 10 is probably controlled by both Cyclin B limitation and the DNA-replication checkpoint.


Figures

Fig. 1
Fig. 1
Live analyses of cell-cycle durations of histone-GFP embryos between cycles 6 and 13. (A-H) Different cycle phases of an embryo at cycle 8. (A) The earliest interphase (000 seconds); (B) last interphase image recorded (230 seconds). Ten seconds later (C), nuclei are in prophase, which is characterized by punctuated GFP signal and loss of the round nuclear morphology. At 440 seconds (D), an obvious metaphase configuration is established and 10 seconds later sister chromatids begin to separate (E), indicating the beginning of anaphase. Between 550 and 600 seconds, nuclei progress from anaphase (F, clear teardrop shape) to telophase (G, more rounded). Ten seconds later (H, 610 seconds), the beginning of interphase of cycle 9 is observed. With this information, we calculated durations of total cell cycles, interphases, prophase-metaphases and anaphase-telophases between cycles 6 and 13. (I) Overall cell-cycle and interphase duration between cycles 6 and 13, based on time-lapse recordings of 39 embryos. For each cycle, number of embryos (N) differs because the quality of recordings improves after cycle 5; before cycle 5, abundant maternal loading of histone-GFP obscures the chromosomal histone-GFP. All data points are aligned at cycle 9, when nuclei migrate to the cortex and pole buds are formed (Foe and Alberts, 1983). Because the preblastoderm cycles are not exactly synchronous (Fig. 2), cell-cycle-phase duration within each cycle was defined as the average of 1-2 nuclei in the middle with 1-2 nuclei in the posterior region of each embryo. (J) Interphase durations of grp1 embryos do not differ from wild-type embryos before cycle 11. The number of grp1 embryos (N’) is shown in J; data for wild-type embryos are taken from I. Scale bar: 30 μm.
Fig. 2
Fig. 2
Metasynchronous mitoses occur prior to cycle 10. (A-F) are images from a time-lapse recording of a histone-GFP embryo at cycle 7. All nuclei are at the beginning of interphase (A) and then enter prophase (B). (C) The nucleus in the posterior region enters anaphase (black arrow), while the one in the middle (white arrow) remains in metaphase and enters anaphase 40 seconds later (D). (E) Both nuclei are in telophase. The two daughter nuclei in (E) moved out of the focal plane but all other nuclei show early interphase configuration of cycle 8 at the same time (F). That nuclei in different regions enter interphase at the same time is supported from other time-lapse recordings. (G) Summary of the regional differences of cell-cycle-phase durations in histone-GFP embryos at cycle 7 (n=9) and cycle 8 (n=17), showing that prophase-metaphase is longer and anaphase-telophase is shorter in the middle region than in the posterior region. The total cell cycle time at cycle 8 is not significantly different in the two regions. (H) An epifluorescence image showing metasynchronous mitoses at cycle 7 from a fixed wild-type embryo: nuclei at the two polar regions are in anaphase, whereas the nuclei in the middle region are in metaphase. Scale bars: 100 μm.
Fig. 3
Fig. 3
Immunostaining and quantification of CycB. (A-D) Wild-type embryos were stained with both anti-CycB (green) and anti-histone H1 (red) antibodies. (A) An energid is outlined and the average pixel intensity within the energid (green channel only) was measured. The outline was defined by taking the shortest distance between yolk granules (black) around the nucleus. Because the average pixel intensities (total pixel numbers within an area divided by the area) were compared, the exact outlines were not crucial for the comparison. (B-D) CycB levels were quantified from three regions (anterior, middle and posterior) in each embryo, averaging the data from three nuclei in each region. In this example, the mean value of the average pixel intensity of the CycB signal was ranked, with the lowest CycB level (74.4±6.3) as 1, the highest (94.6±3.7) as 3 and the middle (85.0±4.1) as 2. (E) Summary of the rank sum of different cell-cycle phases at cycle 7. The asterisks indicate that the regional difference is statistically significant (P<0.04) based on Friedman’s Analysis of Variance by Ranks (Zar, 1999). Scale bars: 20 μm.
Fig. 4
Fig. 4
Timing of cell-cycle phases are sensitive to varying amounts of CycB. Prophasemetaphase (A) and interphase durations (B) in one cycB, two cycB and four cycB embryos determined from live embryos. For each genotype, 15 to 18 embryos were analyzed. Arrows in B refer to the specific cycle when interphase becomes longer: cycle 6 for one cycB embryos, cycle 7 for two cycB embryos and cycle 9 for four cycB embryos. (C) Estimated durations of interphase, metaphase and anaphase of wild-type embryos at cycle 7 based on fixed embryos (n=333 for one cycB embryos, n=915 for two cycB embryos and n=501 for four cycB embryos).
Fig. 5
Fig. 5
Metasynchronous mitoses in blastoderm cycles. TPLSM images of a live embryo showing that, at cycle 12, interphase is longer in the middle region than at the posterior pole. Nuclei at the posterior region enter interphase (A, arrows) 40 seconds earlier than nuclei in the middle region (B, arrows). (C) Nuclei at the posterior region enter prophase, whereas nuclei in the middle enter prophase 90 seconds later (D). In this particular embryo, interphase in the middle region is 50 seconds longer than in the posterior region. (E) Mean values of regional differences of cell-cycle-phase durations in histone-GFP embryos at cycle 11 (n=36) and cycle 12 (n=17), showing that interphase and total cycle are longer in the middle region than the posterior region. Scale bar: 50 μm.
Fig. 6
Fig. 6
Cytoplasmic flow, as indicated by traces of particle movement, during axial expansion (cycle 4 to cycle 8) may contribute to uneven distribution of CycB within an embryo. Both A and B are projections of three-minute time-lapse recordings every 10 seconds of a wild-type embryo at cycle 6. These bright-field transmission images were recorded on a two- photon optical workstation (Wokosin et al., 2003). There is little particle movement in interphase [A, see Baker et al. (Baker et al., 1993) for staging]. By contrast, dramatic particle movement can be observed between interphase and anaphase [B, see Baker et al. (Baker et al., 1993) for staging]. Note the inward flow in the middle region. (C) The direction of the flow in prophase and metaphase. Scale bar: 50 μm.

Similar articles

Cited by

References

    1. Baker J, Theurkauf WE, Schubiger G. Dynamic changes in microtubule configuration correlate with nuclear migration in the preblastoderm Drosophila embryo. J. Cell Biol. 1993;122:113–121. - PMC - PubMed
    1. Blangy A, Lane HA, d’Herin P, Harper M, Kress M, Nigg EA. Phosphorylation by p34cdc2 regulates spindle association of human Eg5, a kinesin-related motor essential for bipolar spindle formation in vivo. Cell. 1995;83:1159–1169. - PubMed
    1. Blankenship JT, Wieschaus E. Two new roles for the Drosophila AP patterning system in early morphogenesis. Development. 2001;128:5129–5138. - PubMed
    1. Centonze VE, White JG. Multiphoton excitation provides optical sections from deeper within scattering specimens than confocal imaging. Biophys. J. 1998;75:2015–2024. - PMC - PubMed
    1. Clarkson M, Saint R. A His2AvDGFP fusion gene complements a lethal His2AvD mutant allele and provides an in vivo marker for Drosophila chromosome behavior. DNA Cell Biol. 1999;18:457–462. - PubMed

Publication types

MeSH terms

LinkOut - more resources