. 2004 Jan 1;32(Database issue):D235-9.
doi: 10.1093/nar/gkh117.

The SUPERFAMILY database in 2004: additions and improvements

Affiliations

The SUPERFAMILY database in 2004: additions and improvements

Martin Madera et al. Nucleic Acids Res. .

Abstract

The SUPERFAMILY database provides structural assignments to protein sequences and a framework for analysis of the results. At the core of the database is a library of profile Hidden Markov Models that represent all proteins of known structure. The library is based on the SCOP classification of proteins: each model corresponds to a SCOP domain and aims to represent an entire superfamily. We have applied the library to predicted proteins from all completely sequenced genomes (currently 154), the Swiss-Prot and TrEMBL databases and other sequence collections. Close to 60% of all proteins have at least one match, and one half of all residues are covered by assignments. All models and full results are available for download and online browsing at http://supfam.org. Users can study the distribution of their superfamily of interest across all completely sequenced genomes, investigate with which other superfamilies it combines and retrieve proteins in which it occurs. Alternatively, concentrating on a particular genome as a whole, it is possible first, to find out its superfamily composition, and secondly, to compare it with that of other genomes to detect superfamilies that are over- or under-represented. In addition, the webserver provides the following standard services: sequence search; keyword search for genomes, superfamilies and sequence identifiers; and multiple alignment of genomic, PDB and custom sequences.


Figures

Figure 1
Figure 1
A section of the domain combination network in E.coli K-12. Nodes represent superfamilies labelled according to their SCOP (3) classification (see below for legend), edges indicate superfamilies that occur next to each other in domain architectures, and arrows show the N-to-C order. Node size and edge thickness are proportional to the logarithm of the number of proteins. All edges between the selected superfamilies are shown. The presence of edges in only one of the two possible directions illustrates the tendency of adjacent domains to appear in one N-to-C order (10,11). This and other visualizations are available online from the webserver. The superfamilies shown in the figure are: a.4.1, homeodomain-like; a.4.2, Methylated DNA–protein cysteine methyltransferase, C-terminal domain; a.60.7, 5′–3′ exonuclease, C-terminal subdomain; b.82.4, regulatory protein AraC; c.35.1, phosphosugar isomerase; c.53.1, resolvase-like; c.55.3, ribonuclease H-like; c.55.7, methylated DNA–protein cysteine methyltransferase domain; d.58.40, d-ribose-5-phosphate isomerase (RpiA), lid domain; d.60.1, probable bacterial effector binding domain; d.144.1, protein kinase-like (PK-like); e.8.1, DNA/RNA polymerases; and g.48.1, Ada DNA repair protein, N-terminal domain (N-Ada 10).
Figure 2
Figure 2
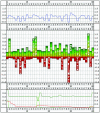
An example of a model diagram, for model 0013580 from the ubiquitin-like superfamily. The top plot (blue line) is the average hydrophobicity, calculated as the sum over all amino acids of match emission probability times ΔGsurface-buried (in kcal/mol). The middle plot shows match emission probabilities. The amino acids in each column are ordered from most hydrophilic (top) to most hydrophobic (bottom). The size of each column is proportional to the difference between the match emission distribution and the generic background distribution. The columns are partitioned between amino acids according to the ratio of their probabilities; only letters larger than a threshold size are shown. The columns are aligned at the bottom of A (alanine). The bottom plot gives the probability that there is an insertion (light green) or a deletion (red) at each position in the HMM. The dark green curve gives the probability P of an insert–insert transition; assuming there is an insertion at that node, 1/(1–P) gives its expected length. The secondary structure of the fragment is readily apparent from the graph: two β sheets (periodicity two) followed by a helix (periodicity three and four).

References

    1. Gough J., Karplus,K., Hughey,R. and Chothia,C. (2001) Assignment of homology to genome sequences using a library of hidden Markov models that represent all proteins of known structure. J. Mol. Biol., 313, 903–919. - PubMed
    1. Gough J. and Chothia,C. (2002) SUPERFAMILY: HMMs representing all proteins of known structure. SCOP sequence searches, alignments and genome assignments. Nucleic Acids Res., 30, 268–272. - PMC - PubMed
    1. Murzin A.G., Brenner,S. E., Hubbard,T. and Chothia,C. (1995) SCOP: a structural classification of proteins database for the investigation of sequences and structures. J. Mol. Biol., 247, 536–540. - PubMed
    1. Eddy S.R. (1998) Profile Hidden Markov Models. Bioinformatics, 14, 755–763. - PubMed
    1. Park J., Karplus,K., Barrett,C., Hughey,R., Haussler,D., Hubbard,T. and Chothia,C. (1998) Sequence comparisons using multiple sequences detect three times as many remote homologs as pairwise methods. J. Mol. Biol., 284, 1201–1210. - PubMed

Publication types