. 2004 Jan 1;32(Database issue):D240-4.
doi: 10.1093/nar/gkh054.

SURFACE: a database of protein surface regions for functional annotation

Affiliations

SURFACE: a database of protein surface regions for functional annotation

Fabrizio Ferrè et al. Nucleic Acids Res. .

Abstract

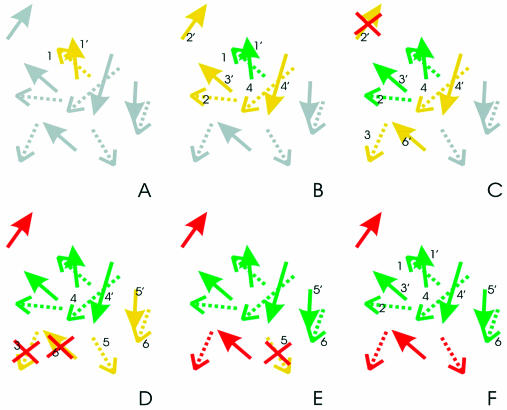
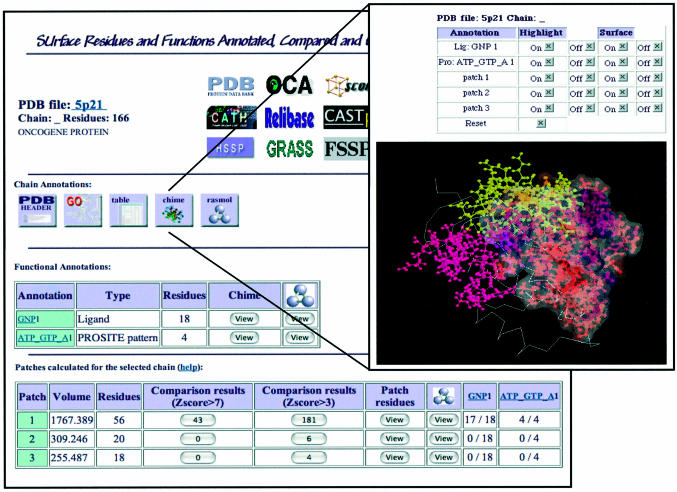
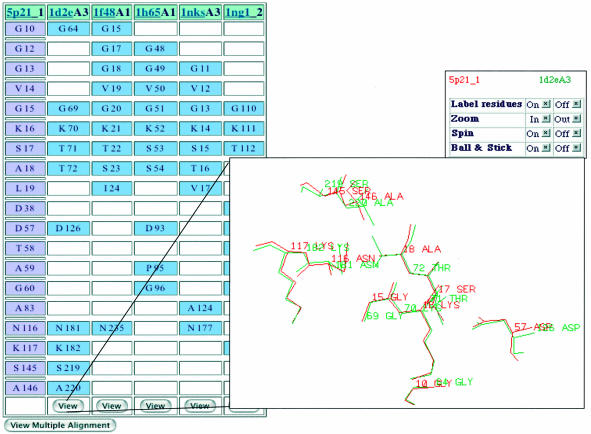
The SURFACE (SUrface Residues and Functions Annotated, Compared and Evaluated, URL http://cbm.bio.uniroma2.it/surface/) database is a repository of annotated and compared protein surface regions. SURFACE contains the results of a large-scale protein annotation and local structural comparison project. A non-redundant set of protein chains is used to build a database of protein surface patches, defined as putative surface functional sites. Each patch is annotated with sequence and structure-derived information about function or interaction abilities. A new procedure for structure comparison is used to perform an all-versus-all patches comparison. Selection of the results obtained with stringent parameters offers a similarity score that can be used to associate different patches and allows reliable annotation by similarity. Annotation exerted through the comparison of regions of protein surface allows the highlighting of similarities that cannot be recognized by other methods of sequence or structure comparison. A graphic representation of the surface patches, functional annotations and the structural superpositions is available through the web interface.


Figures

Figure 1
Figure 1
The residues of the two patches P and P′ are represented as straight and dotted arrows, respectively. Each arrow describes the vector joining the alpha carbon and the pseudoatom calculated as the average coordinate of residue side-chain atoms. The colors of the arrows indicate the status of the different residues in the exploration procedure that selects the best matches between the two patches (grey: residue not yet analyzed; green: residue selected for the match; red: residue excluded from the match; yellow: neighbor of the matching residues). A red cross identifies amino acids that have just been discarded. For the sake of clarity, the two patches are always shown (from A to F) in their best superposition. Please note that, in the procedure, the best superposition is calculated for each pair of residues the algorithm explores when trying to extend the match. (A) Each possible pair of residues is evaluated. In the example the 1–1′ couple is selected to be the first pair of the match (r.m.s.d. and residue similarity better than a fixed threshold). (B) The seed pair is identified and neighboring amino acids are singled out with a distance criterion: residues 2 and 4 of the former patch and 2′, 3′ and 4′ of the latter, and are added to the neighbor list. (C) All possible associations between the neighbor residues are tested trying to extend the match. Pairs 2–3′ and 4–4′ are selected and residue 2′ is discarded. The pair 2–3′ is first added to the match. Residues 3 and 6′ are added to the neighbor list. (D) Residues 3 and 6′ are discarded, pair 4–4′ is added to the match, residues 5, 5′ and 6 are added to the neighbor list. (E) Pair 5′–6 is added to the match, residue 5′ is discarded. (F) The final match length is 4 and is composed of residue pairs 1–1′, 2–3′, 4–4′ and 6–5′.
Figure 2
Figure 2
In the left panel, a summary of the information on the selected protein chain is shown. A list of links to other databases is present in the upper part of the page. Four buttons link to the PDB header, GO terms and information about the selected chain annotations (in tabular and graphic format, as shown in the right panel described below). Two tables display SURFACE database data: the first table lists the annotations, the second shows the patches, sorted according to their evaluated volume. Through this last table, the user gains access to the comparison data, only those with Z-score > 7, or the longer list of those with a Z-score > 3. A graphic view of all the annotations associated to the selected chain residues is accessible by clicking on the appropriate button. On the right, the graphic display of the chain annotations can be viewed in a new page with the CHIME and RasMol plug-ins. The single patches, their surfaces and annotated residues can be labeled and displayed in colors.
Figure 3
Figure 3
A table of the residues associated in the surface comparison matches and selected in the table with the comparison results. Here the five most significant matches obtained for the 5p21 widest patch are shown. The best match involves the third biggest patch of 1d2e, the mitochondrial EF-Tu protein. The match involves residues that are colinear in the superposed protein chains, but that cannot be aligned (sequence similarity 12.2). By clicking on the appropriate ‘view’ button, the user can display the superposition of the equivalenced residues.

References

    1. Schmid M.B. (2002) Structural proteomics: the potential of high-throughput structure determination. Trends Microbiol., 10 (Suppl.), S27–S31. - PubMed
    1. Kinoshita K., Furui,J. and Nakamura,H. (2001) Identification of protein functions from a molecular surface database, eF-site. J. Struct. Funct. Genomics, 2, 9–22. - PubMed
    1. Schmitt S., Kuhn,D. and Klebe,G. (2002) A new method to detect related function among proteins independent of sequence and fold homology. J. Mol. Biol., 323, 387–406. - PubMed
    1. Holm L. and Sander,C. (1996) Mapping the protein universe. Science, 273, 595–603. - PubMed
    1. Holm L. and Sander,C. (1997) An evolutionary treasure: unification of a broad set of amidohydrolases related to urease. Proteins, 28, 72–82. - PubMed

Publication types