

. 2004 Jan 1;32(Database issue):D552-6.
doi: 10.1093/nar/gkh029.
GenePaint.org: an atlas of gene expression patterns in the mouse embryo
Affiliations
- PMID: 14681479
- PMCID: PMC308763
- DOI: 10.1093/nar/gkh029
Item in Clipboard
GenePaint.org: an atlas of gene expression patterns in the mouse embryo
Nucleic Acids Res.
.
Abstract
High-throughput instruments were recently developed to determine gene expression patterns on tissue sections by RNA in situ hybridization. The resulting images of gene expression patterns, chiefly of E14.5 mouse embryos, are accessible to the public at http://www.genepaint.org. This relational database is searchable for gene identifiers and RNA probe sequences. Moreover, patterns and intensity of expression in approximately 100 different embryonic tissues are annotated and can be searched using a standardized catalog of anatomical structures. A virtual microscope tool, the Zoom Image Server, was implemented in GenePaint.org and permits interactive zooming and panning across approximately 15,000 high-resolution images.
Figures
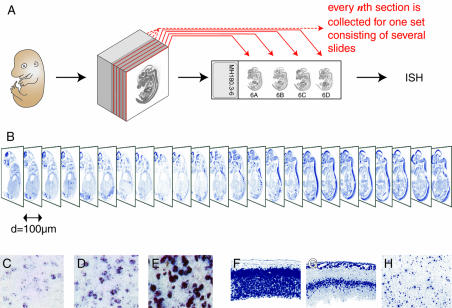
GenePaint image data. (A) A day 14.5 mouse embryo, embedded in a block of cryomedium, is cryosectioned at 20 µm thickness. The first, sixth, eleventh, etc., section is collected onto standard size microscopy slides constituting one slide set. Starting with the second, third, fourth and fifth section, four more slide sets are generated in an analogous manner. Hence a single embryo gives rise to a total of five sets of slides. (B) Each slide set is hybridized with a particular riboprobe of interest and digital images are created. Typically, an E14.5 embryo is accommodated on six slides with four sections each, resulting in a 24 image stack that covers all major organ systems. (C–E) illustrate the strength of expression. Weak (C), medium (D) and strong (E) are characterized by different quantities of color precipitate within cells expressing the gene in question. (F–H) illustrate expression patterns that can either be ubiquitous, regional or scattered. Foxg1 (F) is ubiquitous in the E14.5 cerebral cortex as it is expressed by all cells (GenePaint set MH224). Expression of Cxcl12 (G) encoding a chemokine ligand is regional since its transcripts are restricted to the intermediate layer of the developing cortex (GenePaint set MH428). Neuropeptide Y (H) is expressed by a subset of cells in all layers of the adult cortex (GenePaint set HB244); expression is thus scattered.
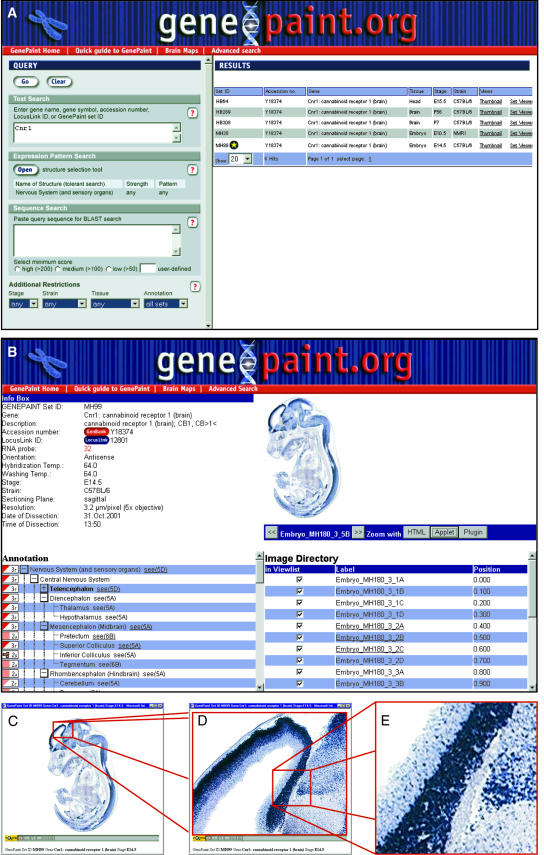
Steps of a query for expression data based on a gene name. (A) In order to localize expression data for cannabinoid receptor 1, its LocusLink gene symbol ‘Cnr1’ is typed into the query field. Several data sets at different developmental stages are displayed as results. (B) Data set MH99 is selected and opened in the set viewer. Information related to this gene and data set is displayed in the left part of the page, along with the annotation of the expression pattern. Browsing through the list of images in the right part of the page, an image of interest is selected and opened in the Java applet viewer (C). (D) Any region of the image can be magnified either by stepwise zooming in or by directly selecting a rectangle of interest. (E) At the maximum zoom level, single cells are distinguishable [magnified view of the original screenshot in (D) without further resolution enhancement].
References
-
- Lander E.S., Linton,L.M., Birren,B., Nusbaum,C., Zody,M.C., Baldwin,J., Devon,K., Dewar,K., Doyle,M., FitzHugh,W. et al. (2001) Initial sequencing and analysis of the human genome. Nature, 409, 860–921. - PubMed
-
- Venter J.C., Adams,M.D., Myers,E.W., Li,P.W., Mural,R.J., Sutton,G.G., Smith,H.O., Yandell,M., Evans,C.A., Holt,R.A. et al. (2001) The sequence of the human genome. Science, 291, 1304–1351. - PubMed
-
- Waterston R.H., Lindblad-Toh,K., Birney,E., Rogers,J., Abril,J.F., Agarwal,P., Agarwala,R., Ainscough,R., Alexandersson,M., An,P. et al. (2002) Initial sequencing and comparative analysis of the mouse genome. Nature, 420, 520–562. - PubMed
-
- Okazaki Y., Furuno,M., Kasukawa,T., Adachi,J., Bono,H., Kondo,S., Nikaido,I., Osato,N., Saito,R., Suzuki,H. et al. (2002) Analysis of the mouse transcriptome based on functional annotation of 60 770 full-length cDNAs. Nature, 420, 563–573. - PubMed
-
- Barlow C. and Lockhart,D.J. (2002) DNA arrays and neurobiology—what’s new and what’s next? Curr. Opin. Neurobiol., 12, 554–561. - PubMed
Publication types
MeSH terms
Substances
LinkOut - more resources
Full Text Sources
Other Literature Sources
Molecular Biology Databases
