. 2004 Jan 6;101(1):245-50.
doi: 10.1073/pnas.2536801100. Epub 2003 Dec 17.

T cell chemotaxis to lysophosphatidylcholine through the G2A receptor

Affiliations

T cell chemotaxis to lysophosphatidylcholine through the G2A receptor

Caius G Radu et al. Proc Natl Acad Sci U S A. .

Abstract

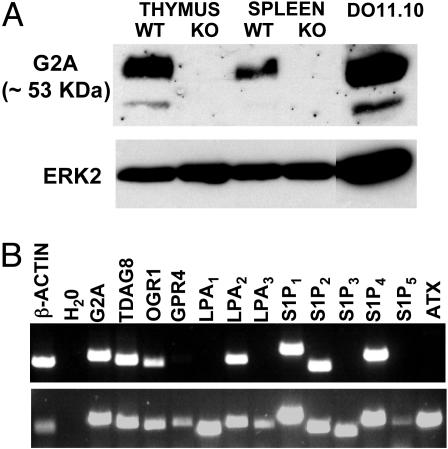
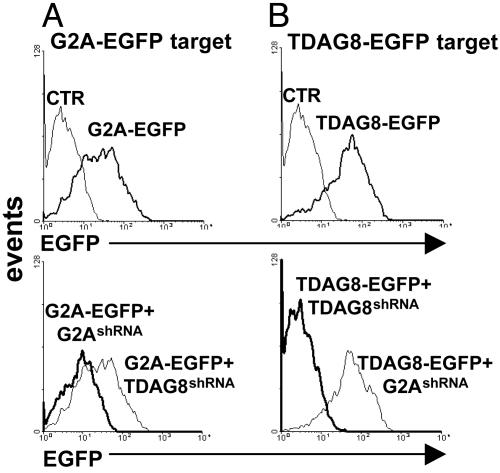
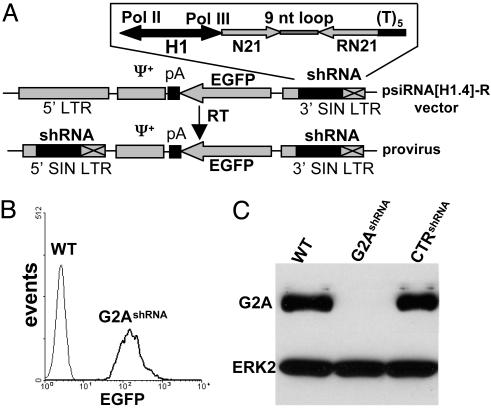
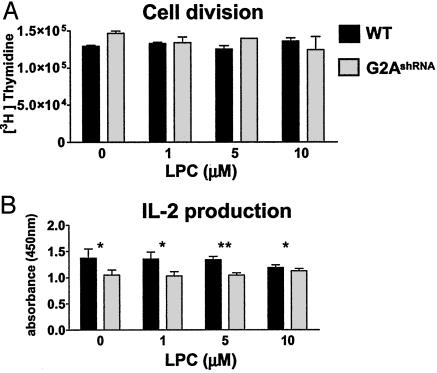
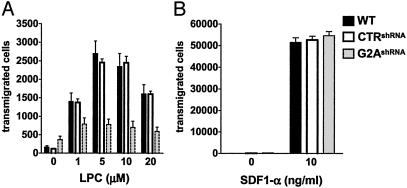
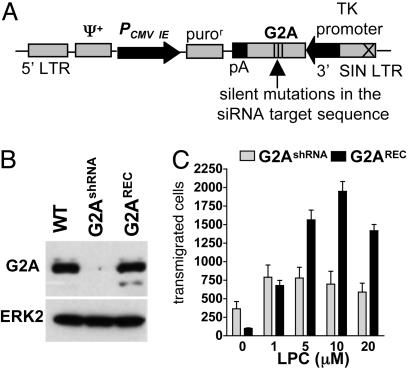
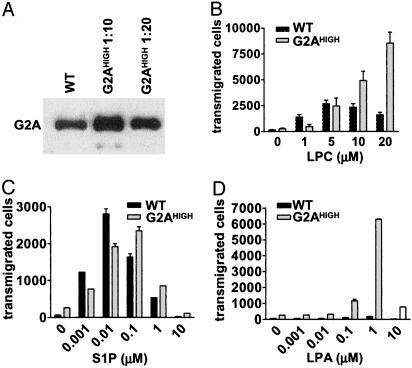
G2A is an immunoregulatory G protein-coupled receptor predominantly expressed in lymphocytes and macrophages. Ectopic overexpression studies have implicated G2A as a receptor for the bioactive lysophospholipid, lysophosphatidylcholine (LPC). However, the functional consequences of LPC-G2A interaction at physiological levels of receptor expression, and in a cellular context relevant to its immunological role, remain largely unknown. Here, we show impaired chemotaxis to LPC of a T lymphoid cell line in which G2A expression was chronically down-regulated by RNA interference technology. Rescuing this phenotype by reconstitution of the physiological level of receptor expression further supports a functional connection between LPC-G2A interaction and cellular motility. Overexpression of G2A in the T lymphoid cell line significantly enhanced chemotaxis to LPC. It also modified migration toward the LPC-related molecule, lysophosphatidic acid, indicating the possibility of crosstalk between G2A and endogenous lysophosphatidic acid receptors. The role of G2A in LPC-mediated cell migration may be relevant to the autoimmune syndrome associated with genetic inactivation of this G protein-coupled receptor in mice. The experimental system described here can be useful for understanding the structural requirements for LPC recognition by G2A and the signaling pathways regulated by this ligand-receptor pair.


Figures

Fig. 1.
Fig. 1.
Expression of G2A in DO11.10 cells. (A) (Upper) Detection of G2A by Western blot by using the rabbit polyclonal antibody. (Lower) Extracellular signal-regulated kinase 2 loading control using a polyclonal rabbit antibody from Santa Cruz Biotechnology. (B)(Upper) RT-PCR analysis of the expression of LP-specific GPCRs and of ATX in DO11.10 cells. (Lower) Control RT-PCR by using a mixture of cDNAs from mouse brain, heart, spleen, and prostate.
Fig. 2.
Fig. 2.
Cotransfection of EGFP-tagged GPCRs and sh RNAs encoding plasmids to select siRNA target sequences. HEK 293T cells were transfected with expression vectors encoding G2A-EGFP (A) or TDAG8-EGFP (B) fusions, alone or in combination shRNA plasmids. Forty-eight hours later, the level of EGFP fluorescence was determined by fluorescence-activated cell sorting and used as an indicator of silencing efficiency.
Fig. 3.
Fig. 3.
siRNA-mediated silencing of G2A in DO11.10 cells. (A) Retroviral vector design. The bidirectional human H1-RNA promoter (H1) coordinates expression of the effector shRNA (RNA polymerase III-dependent) and of EGFP (RNA polymerase II-dependent). Reverse transcription results in the duplication of the shRNA cassette inserted in the 3′ self-inactivating retroviral LTR (3′ SIN LTR): N21, target sequence, sense; RN21, target sequence, antisense; (T)5, termination signal for the RNA polymerase III; pA, polyadenylation signal. (B) Expression of the EGFP-colinked marker by retrovirally transduced DO11.10 cells. (C)(Upper) Western blot analysis by using the rabbit polyclonal antibody of the expression of G2A in DO11.10 T cells transduced with G2A-specific (G2AshRNA) or control (CTRshRNA) shRNA encoding retroviruses. (Lower) Extracellular signal-regulated kinase 2 loading control.
Fig. 4.
Fig. 4.
Chronic siRNA-mediated suppression of G2A is well tolerated by DO11.10 cells. (A) DNA synthesis rate. The 5 × 10⁴ WT or G2A-silenced DO11.10 cells (G2AshRNA) in SFM containing 0.1% FAF-BSA were treated with indicated concentrations of LPC. The rate of DNA synthesis was determined by pulsing the cells with [3H]thymidine for 12 h. (B) IL-2 production. The 5 × 10⁴ DO11.10 cells in SFM with 0.1% FAF-BSA were stimulated for 24 h with 5 μg/ml plate-bound antibody against the CD3ε chain (2C11-145) in the presence of indicated amounts of LPC. Production of IL-2 was determined by capture ELISA. The results are representative of three independent experiments. *, P > 0.05; **, P < 0.05. Student's t test was performed by using prism software (GraphPad, San Diego). P < 0.05 was considered to be statistically significant.
Fig. 5.
Fig. 5.
G2A-dependent chemotaxis to LPC. Equal numbers (2 × 10⁵) of WT and G2AshRNA or control (CTRshRNA) DO11.10 cells were washed three times with SFM containing 0.1% FAF-BSA, mixed, and added to the upper chamber of a 24-well plate with 5.0-μm pore size polycarbonate filters (Costar). LPC (A) or SDF1-α (B) was added to the lower chamber. After a 2-h incubation at 37°C in an 8% CO2 incubator, transmigrated WT and EGFP-positive siRNA-transduced cells were counted by fluorescence-activated cell sorting. The results are representative of four independent experiments.
Fig. 6.
Fig. 6.
Reconstitution of G2A expression in shRNA-transduced cells rescues chemotaxis to LPC. (A) Schematic representation of the retroviral vector used for G2A reconstitution. The immediate early cytomegalovirus promoter (PCMV IE) drives the expression of the puromycin resistance gene (puror). Expression of the siRNA refractory form of G2A is driven by the thymidine kinase promoter. (B) A Western blot to determine expression levels of G2A in WT, G2AshRNA, and G2AshRNA cells transduced with the G2A reconstitution vector (G2AREC) and selected by using 1 μg/ml puromycin. (C) Chemotaxis of G2AshRNA and G2AREC cells to various concentrations of LPC. The results are representative of three independent experiments.
Fig. 7.
Fig. 7.
Effects of G2A overexpression in DO11.10 cells. (A) A Western blot to estimate the amount of G2A in cells overexpressing the receptor (G2AHIGH, lysates from these cells were diluted 10- and 20-fold before analysis). Chemotaxis of WT and G2AHIGH cells to LPC (B), S1P (C), and LPA (D) is shown. The results are representative of three independent experiments.

References

    1. Lombardi, M. S., Kavelaars, A. & Heijnen, C. J. (2002) Crit. Rev. Immunol. 22, 141-163. - PubMed
    1. Fukushima, N., Ishii, I., Contos, J. J., Weiner, J. A. & Chun, J. (2001) Annu. Rev. Pharmacol. Toxicol. 41, 507-534. - PubMed
    1. Kabarowski, J. H., Xu, Y. & Witte, O. N. (2002) Biochem. Pharmacol. 64, 161-167. - PubMed
    1. Weng, Z., Fluckiger, A. C., Nisitani, S., Wahl, M. I., Le, L. Q., Hunter, C. A., Fernal, A. A., Le Beau, M. M. & Witte, O. N. (1998) Proc. Natl. Acad. Sci. USA 95, 12334-12339. - PMC - PubMed
    1. Kabarowski, J. H. S., Zhu, K., Le, L. Q., Witte, O. N. & Xu, Y. (2001) Science 293, 702-705. - PubMed

Publication types