Comparative Study
. 2004 Jan;74(1):40-9.
doi: 10.1086/381040. Epub 2003 Dec 17.

Population-genetic basis of haplotype blocks in the 5q31 region

Affiliations
Comparative Study

Population-genetic basis of haplotype blocks in the 5q31 region

Eric C Anderson et al. Am J Hum Genet. 2004 Jan.

Abstract

We investigated patterns of nucleotide variation in the 5q31 region identified by Daly et al. as containing haplotype blocks, to determine whether the blocklike pattern requires the assumption of hotspots in recombination. Using extensive simulations that generate data matched to the Daly et al. data set in (a) the method of ascertainment of single-nucleotide polymorphisms, (b) the heterozygosity of ascertained markers, (c) the number of block boundaries, and (d) the diversity of haplotypes within blocks, we show that the patterns found in the Daly et al. data are not consistent with the assumption of uniform recombination in a population of constant size but are consistent either with the presence of hotspots in a population of constant size or with the absence of hotspots if there was a period of rapid population growth. We further show that estimates of local recombination rate can distinguish between population growth and hotspots as the primary cause of a blocklike pattern. Estimates of local recombination rates for the Daly et al. data do not indicate the presence of recombination hotspots.


Figures

Figure  1
Figure 1
Blocks in 5q31. Blocks inferred by Daly et al. (2001) (a) and MDBlocks (b). Each dot represents 1 of the 103 SNPs. Vertical bars represent block boundaries. Some SNPs were not included by Daly et al. (2001) in any blocks. These are denoted by the absence of a dot between the adjacent block boundaries. The bottom row of dots (c) shows the physical map location of the markers in the 635-kb span of the chromosome within which Rioux et al. (2001) sequenced. The map is relative to panel d, in which arrows delimit the extent of the 285-kb “central core” region that was exhaustively resequenced in eight chromosomes by Rioux et al. (2001) and the 150- and 200-kb flanking regions that were only partially resequenced. e, Regions in which markers were ascertained during our simulations. The darkened portions of the discontinuous line were regions in which markers could be ascertained. This pattern approximates the resequencing tiles described in Rioux et al. (2001).
Figure  2
Figure 2
Haplotype diversity within blocks. Each line shows the cumulative frequency of haplotypes within one of the 11 blocks identified by MDBlocks in the 5q31 data. As is apparent, in every block except one, the four most frequent haplotypes account for >75% of the haplotypes observed.
Figure  3
Figure 3
Results for data simulated under the neutral coalescent, with constant population size. Top row, The distribution of the number of blocks inferred by MDBlocks, with θ=63 and ρ=200 (a), ρ=400 (b), and ρ=600 (c). Columns representing 10, 11, and 12 blocks are shaded. Bottom row, Number of high-diversity blocks found among 10, 11, or 12 blocks, with θ=63, ρ=200 (d), ρ=400 (e), and ρ=600 (f). Dark arrows show the number of high-diversity blocks in the 5q31 data—well below the number observed in all the simulations.
Figure  4
Figure 4
Results for data simulated under the neutral coalescent, with constant population size and 10 recombination hotspots. Top row, The distribution of the number of blocks inferred by MDBlocks, with ρ=150 and weak (a), intermediate (b), and strong (c) hotspot intensity. Bottom row, Number of high-diversity blocks found among 10, 11, or 12 blocks with weak (d), intermediate (e), and strong (f) recombination. Dark arrows show the number of high-diversity blocks in the 5q31 data—not a likely outcome for any but the strong hotspots.
Figure  5
Figure 5
Number of high-diversity blocks found among 10, 11, or 12 blocks, in data simulated under the neutral coalescent with population growth and bottlenecks. a, Scenario of growth with no bottleneck: population is of constant size, 10,000 individuals until 100,000 years ago, at which point exponential growth commences. Present population size is 10 million individuals. θ=62; ρ=15. Dark arrows show the number of high-diversity blocks in the 5q31 data. b, Scenario with a bottleneck: simulation parameters correspond to a population that was of constant size, 10,000 individuals, until 102,000 years ago, at which point there was a bottleneck of 1,000 individuals lasting for 2,000 years. After the bottleneck, the population size increases to 10 million individuals in 100,000 years. θ=78, ρ=21.
Figure  6
Figure 6
Proportion of testable block boundaries identified as potential hotspots in the Daly et al. (2001) data and under the three simulation models described in the text. a, Data simulated under scenario of population growth with no bottleneck. b, Data simulated under scenario of population growth with a bottleneck. c, Results of 200 imputations of the missing data in the 5q31 data. d, Data simulated under the model of constant population size with 10 strong hotspots. Lines a–c extend from the 0th percentile to the 95th percentile of the proportion of testable block boundaries identified as potential hotspots. Line d extends from the 5th percentile to the 100th percentile of the proportion of testable block boundaries identified as potential hotspots.
Figure  7
Figure 7
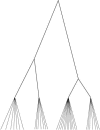
A palmetto genealogy representing the ancestry of a single haplotype block. The terminal branches connected to each internal branch represent lineages arising after the onset of population growth. The internal branches represent very old lineages on which mutations accumulated that distinguish different haplotypes within a block. Recombination events among the terminal branches would not affect the overall block structure but would create chimeric haplotypes of the kind found in the Daly et al. (2001) data set.

References

Electronic-Database Information

    1. makesamples, http://home.uchicago.edu/~rhudson1/source/mksamples.html (for the program for generating samples under neutral models)
    1. maxhap, http://home.uchicago.edu/~rhudson1/source/maxhap.html (for the program for estimating ρ (4Nr), a crossing-over parameter, and f(=g/r), a gene conversion parameter, through use of a maximum composite likelihood method)
    1. MDBlocks, http://ib.berkeley.edu/labs/slatkin/eriq/software/mdb_web/index.htm (for the haplotype block–partitioning program)
    1. Whitehead/MIT Center for Genome Research, http://www-genome.wi.mit.edu/humgen/IBD5/index.html (for 5q31 data)

References

    1. Anderson EC, Novembre J (2003) Finding haplotype block boundaries by using the minimum-description-length principle. Am J Hum Genet 73:336–354 - PMC - PubMed
    1. Couzin J (2002) Human genome: HapMap launched with pledges of $100 million. Science 298:941–94210.1126/science.298.5595.941a - DOI - PubMed
    1. Daly MJ, Rioux JD, Schaffner SF, Hudson TJ, Lander ES (2001) High-resolution haplotype structure in the human genome. Nat Genet 29:229–23210.1038/ng1001-229 - DOI - PubMed
    1. Gabriel SB, Schaffner SF, Nguyen H, Moore JM, Roy J, Blumenstiel B, Higgins J, DeFelice M, Lochner A, Faggart M, Liu-Cordero SN, Rotimi C, Adeyemo A, Cooper R, Ward R, Lander ES, Daly MJ, Altshuler D (2002) The structure of haplotype blocks in the human genome. Science 296:2225–222910.1126/science.1069424 - DOI - PubMed
    1. Goldstein DB (2001) Islands of linkage disequilibrium. Nat Genet 29:109–11110.1038/ng1001-109 - DOI - PubMed

Publication types