. 2004 Jan 12;468(3):361-79.
doi: 10.1002/cne.10995.

Organization of suprachiasmatic nucleus projections in Syrian hamsters (Mesocricetus auratus): an anterograde and retrograde analysis

Affiliations

Organization of suprachiasmatic nucleus projections in Syrian hamsters (Mesocricetus auratus): an anterograde and retrograde analysis

Lance J Kriegsfeld et al. J Comp Neurol. .

Abstract

Circadian rhythms in physiology and behavior are controlled by pacemaker cells located in the suprachiasmatic nucleus (SCN) of the hypothalamus. The mammalian SCN can be classified into two subdivisions (core and shell) based on the organization of neuroactive substances, inputs, and outputs. Recent studies in our laboratory indicate that these subdivisions are associated with functional specialization in Syrian hamsters. The core region, marked by calbindin-D(28K) (CalB)-containing cells, expresses light-induced, but not rhythmic, clock genes. In the shell compartment, marked by vasopressinergic cells and fibers, clock gene expression is rhythmic. Given these findings, an important question is how photic and rhythmic information are integrated and communicated from each of these regions to effector areas. The present study used localized, intra-SCN iontophoretic injections of the anterograde tracer biotinylated dextran amine (BDA) to investigate intra-SCN connectivity and the neural pathways by which information is communicated from SCN subregions to targets. Intra-SCN connections project from the core to the shell compartment of the SCN, but not from the shell to the CalB region of the SCN. Retrograde tracing experiments were performed using cholera toxin-beta (CTB) to determine more specifically whether SCN efferents originated in the core or shell using neurochemical markers for the rhythmic (vasopressin) and light-induced (CalB) SCN subregions. The combined results from anterograde and retrograde experiments suggest that all SCN targets receive information from both the light-induced and rhythmic regions of the SCN (albeit to varying degrees) and indicate that light and rhythmic information may be integrated both within the SCN and at target effector areas.


Figures

Fig. 1
Fig. 1
Schematic diagrams depicting the location of BDA injections for eight animals. Black regions show the center of the injection site, and gray areas represent the “halo” comprising the less densely stained surrounding immunoreactive zone. 3V, third ventricle.
Fig. 2
Fig. 2
A–L: Medium-power photomicrographs showing the injection site and labeled brain regions from entire, shell, and core SCN injections of BDA. In the top row, brain sections show the center of the injection site (outlined with a dashed white line) defined by fluorescent labeling. Each subsequent row depicts a different target area of the SCN. Each column corresponds to the injection depicted in the top row of the same column. For the PVH/SPVZ, the arrow points to the general location of the SPVZ. For abbreviations, see list. Scale bar = 200 μm in A–D; 100 μm in E–L.
Fig. 2
Fig. 2
A–L: Medium-power photomicrographs showing the injection site and labeled brain regions from entire, shell, and core SCN injections of BDA. In the top row, brain sections show the center of the injection site (outlined with a dashed white line) defined by fluorescent labeling. Each subsequent row depicts a different target area of the SCN. Each column corresponds to the injection depicted in the top row of the same column. For the PVH/SPVZ, the arrow points to the general location of the SPVZ. For abbreviations, see list. Scale bar = 200 μm in A–D; 100 μm in E–L.
Fig. 3
Fig. 3
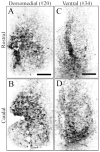
High-power photomicrographs showing the rostral (A,B) and caudal (C,D) SCN for representative injections of BDA localized to either the dorsomedial (A,C) or the ventral (B,D) SCN. Note that a fold in the tissue in the rostral SCN for the ventral injection (B) makes it appear as if the tracer spread more dorsally than the actual tracer deposit. Scale bars = 100 μm.
Fig. 4
Fig. 4
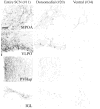
High-power photomicrographs of a subset of SCN targets following injections in the entire, dorsomedial, or ventral SCN. Presumptive boutons are present in all micrographs demonstrating innervation by both core and shell subregions, albeit to varying degrees. For abbreviations, see list. Scale bar =100 μm.
Fig. 5
Fig. 5
Low-power photomicrograph of a coronal brain section showing the core of the injection site for #19 defined by fluorescent labeling (A). The center of the injection is outlined with a dashed white line. The remainder of the figure (B–H) depicts coronal sections through the brain of animal #19 showing the distribution of BDA-positive fibers at the level of LSv, AVPV, PVHap, VLPO, PVT, IGL, and PAG. Note the high density of staining in the LSv (E) and PVT (G) relative to the more diffuse staining seen at the level of the AVPV (E), and VLPO (F). For abbreviations, see list. Scale bar = 200 μm, in A; 100 μm in B–H.
Fig. 6
Fig. 6
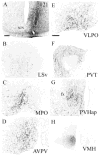
Low-power photomicrograph of a coronal brain section showing the core of the injection site for #21 defined by fluorescent labeling (A). The center of the injection is outlined with a dashed white line. The remainder of the figure (B–H) depicts coronal sections through the brain of animal #21 showing the distribution of BDA-positive fibers at the level of LSv, MPO, AVPV, VLPO, PVT, PVHap, and VMH. Note the high density of staining in the VLPO (E), PVHap (G), and VMH (H) relative to the more diffuse staining seen at the level of the AVPV (E) directly surrounding the third ventricle. For abbreviations, see list. Scale bar = 200 μm in A,H; 100 μm in B–G.
Fig. 7
Fig. 7
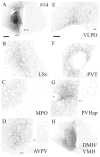
Low-power photomicrograph of a coronal brain section showing the core of the injection site for #14 defined by fluorescent labeling (A). The center of the injection is outlined with a dashed white line. The remainder of the figure (B–H) depicts coronal sections through the brain of animal #14 showing the distribution of BDA-positive fibers at the level of LSv, MPO, AVPV, VLPO, PVT, PVHap, and VMH. Note the high density of staining in the VLPO (E), PVHap (G), and VMH (H) relative to the more diffuse staining seen at the level of the AVPV (E) directly surrounding the third ventricle, and the paucity of labeling in the MPO. For abbreviations, see list. Scale bar = 200 μm in A (also applies to H; 100 μm in E (applies to B–G).
Fig. 8
Fig. 8
Schematic diagrams in the coronal plane showing the location of CTB injections. Images proceed from rostral to caudal. For abbreviations, see list.
Fig. 9
Fig. 9
Representative photomicrographs from brains of animals injected with CTB in either the LS (A–C), DMH (D–F), or VLPO (G–I). Column 1 shows the injection sites labeled with CTB in red. Columns 2 and 3 show double-label fluorescence immunohistochemical staining for CTB (green) and CalB (red, column 2) or CTB (green) and AVP (red, column 3). Note that an injection in the LS resulted in retrograde label concentrated in the core region of the SCN (overlapping with CalB), whereas CTB injection in the DMH resulted in more diffuse retrograde label in both the core and shell (AVP-ir) SCN. In contrast, injection of CTB in the VLPO resulted in labeling predominantly in the vasopressin-rich SCN shell, with scattered neuronal label in the core. Green=AVP or CalB, Red=CTB. Insets show high-power images of cells pointed to in low-power micrographs. Arrows for VLPO point to retrogradely labeled cells in either the CalB core (H) or AVP shell (I). For abbreviations, see list. Scale bar = 200 μm in A (also applies to D,G); 100 μm in B (also applies to C,E,F,H,I).
Fig. 10
Fig. 10
Low- and high-power photomicrographs of coronal sections showing the distribution of intra-SCN BDA-positive fibers in relation to the subregion of the SCN expressing CalB. CalB and BDA were double-labeled in the same brain section, but CalB and BDA are shown separately (A,B,F,G) and together (C,H) for visibility. The two animals shown here represent examples of the two patterns of staining seen with localized intra-SCN injections of BDA. The top figures (A–E) represent the general pattern of staining seen with a dorsal or medial injection (#20 and #17); the bottom photomicrographs (F–J) represent the general pattern of staining seen with a ventral injection (#34 and #26). High-power photomicrographs of the CalB region of the ipsilateral (D, I) and contralateral (E, J) SCN are shown to highlight differences between dorsomedial (D, E) and ventral (I, J) SCN projections to these CalB cells. Scale bar = 100 μm, in F (also applies to A–C,G.H; low-power photomicrographs); 50 μm in I (also applies to D,E,J; high-power photomicrographs).
Fig. 11
Fig. 11
Summary of results from both anterograde and retograde tracing studies. Top: Schematic drawing in the sagittal plane summarizing the efferent projections arising from primarily from either the shell (solid line) or core (dashed line) SCN subdivisions. For the SPVZ, the medial (M) and lateral (L) divisions are depicted separately. Bottom: Summary of projections to SCN targets. Projections from the shell (vasopressin) SCN are on the left, and projections from the core (CalB) are on the right. The thickness of the lines projecting to the target regions represents the density of each projection. For abbreviations, see list.
Fig. 12
Fig. 12
Theoretical model of photic entrainment, rhythmicity generation, and communication to effector areas based on available findings and results from the present study. According to this model, light information is received by the SCN core and transmitted via neural connections to the “rhythmic” shell. Projections to targets of the SCN arise from both the core (CalB) and shell (vasopressin) subdivisions, suggesting that phase and rhythmic information is integrated at target sites in addition to within the SCN. For abbreviations, see list.

Similar articles

Cited by

References

    1. Ambrahamson EE, Moore RY. Suprachiasmatic nucleus in the mouse: retinal innervation, intrinsic organization and efferent projections. Brain Res. 2001;916:172–191. - PubMed
    1. Antle MC, Foley DK, Foley NC, Silver R. Gates and oscillators: a network model of the brain clock. J Biol Rhythms. 2003;18:339–350. - PMC - PubMed
    1. Bartness TJ, Song CK, Demas GE. SCN efferents to peripheral tissues: implications for biological rhythms. J Biol Rhythms. 2001;16:196–204. - PubMed
    1. Bamshad M, Aoki VT, Adkison MG, Warren WS, Bartness TJ. Central nervous system origins of the sympathetic nervous system outflow to white adipose tissue. Am J Physiol. 1998;275:R291–299. - PubMed
    1. Bamshad M, Song CK, Bartness TJ. CNS origins of the sympathetic nervous system outflow to brown adipose tissue. Am J Physiol. 1999;276:R1569–1578. - PubMed

Publication types

LinkOut - more resources