. 2004 Mar 12;279(11):10422-32.
doi: 10.1074/jbc.M312410200. Epub 2003 Dec 18.

Lecithin-retinol acyltransferase is essential for accumulation of all-trans-retinyl esters in the eye and in the liver

Affiliations

Lecithin-retinol acyltransferase is essential for accumulation of all-trans-retinyl esters in the eye and in the liver

Matthew L Batten et al. J Biol Chem. .

Abstract

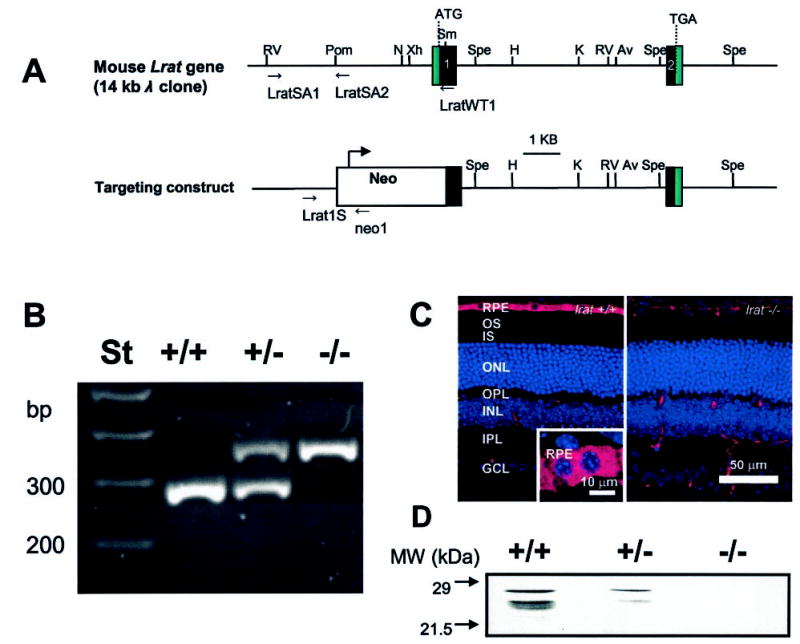
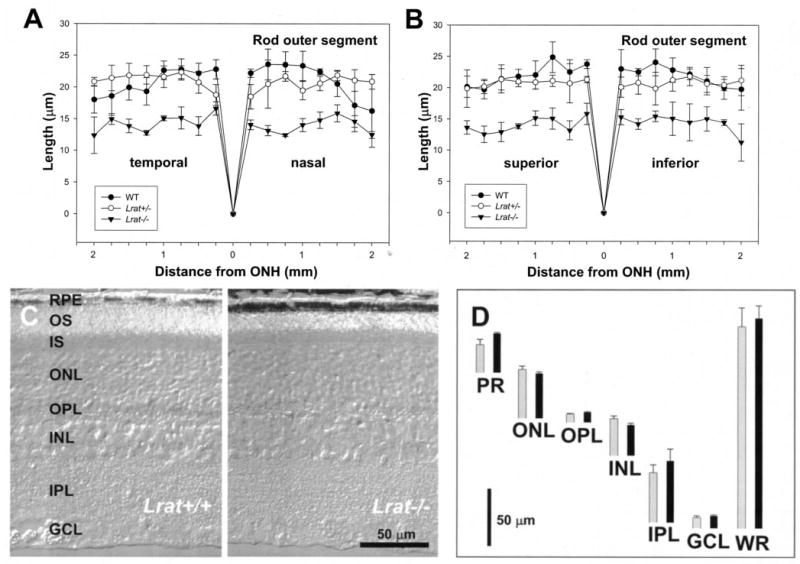
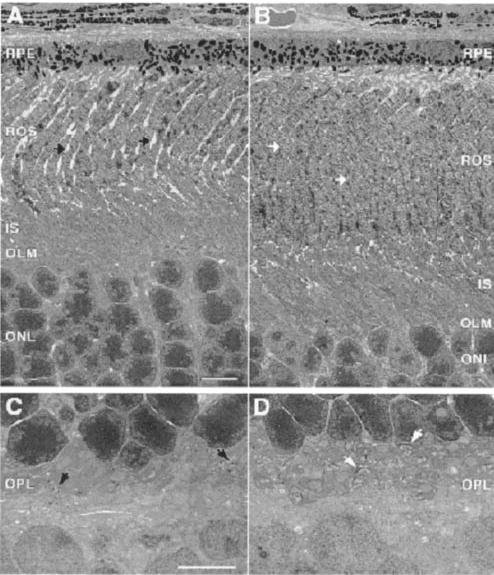
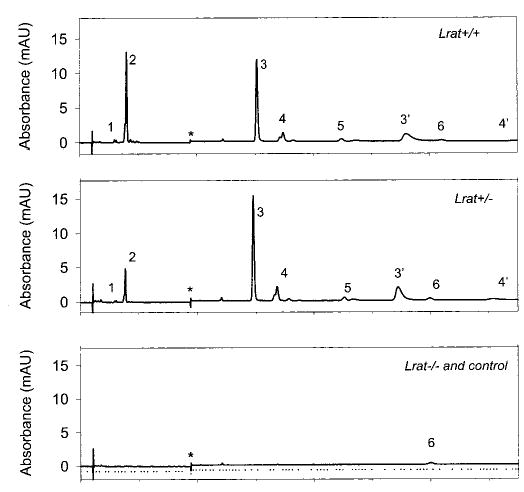
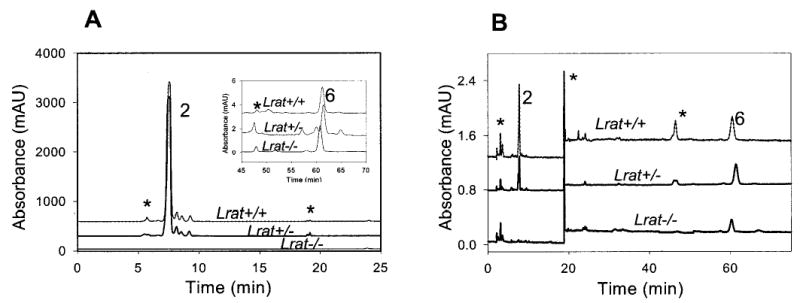
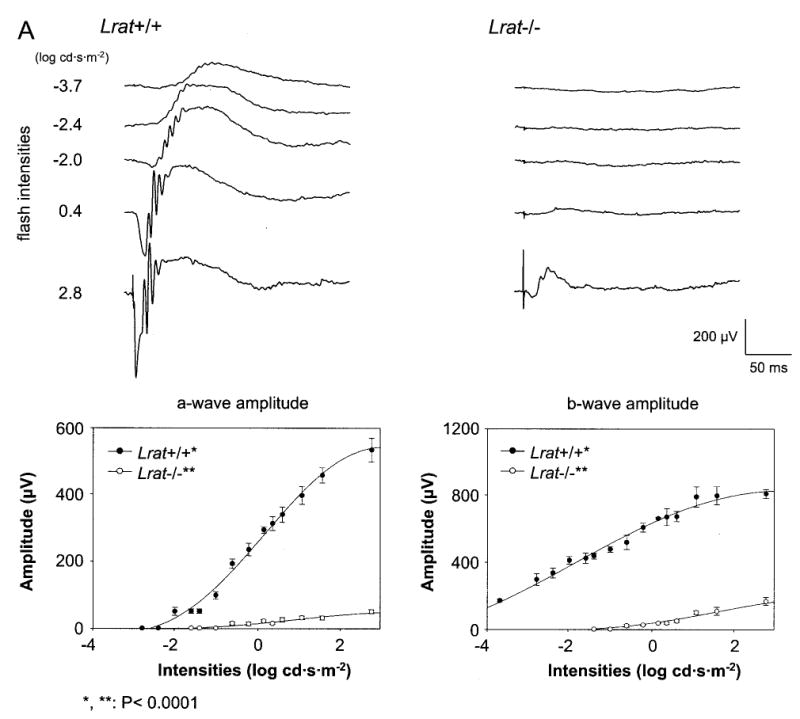
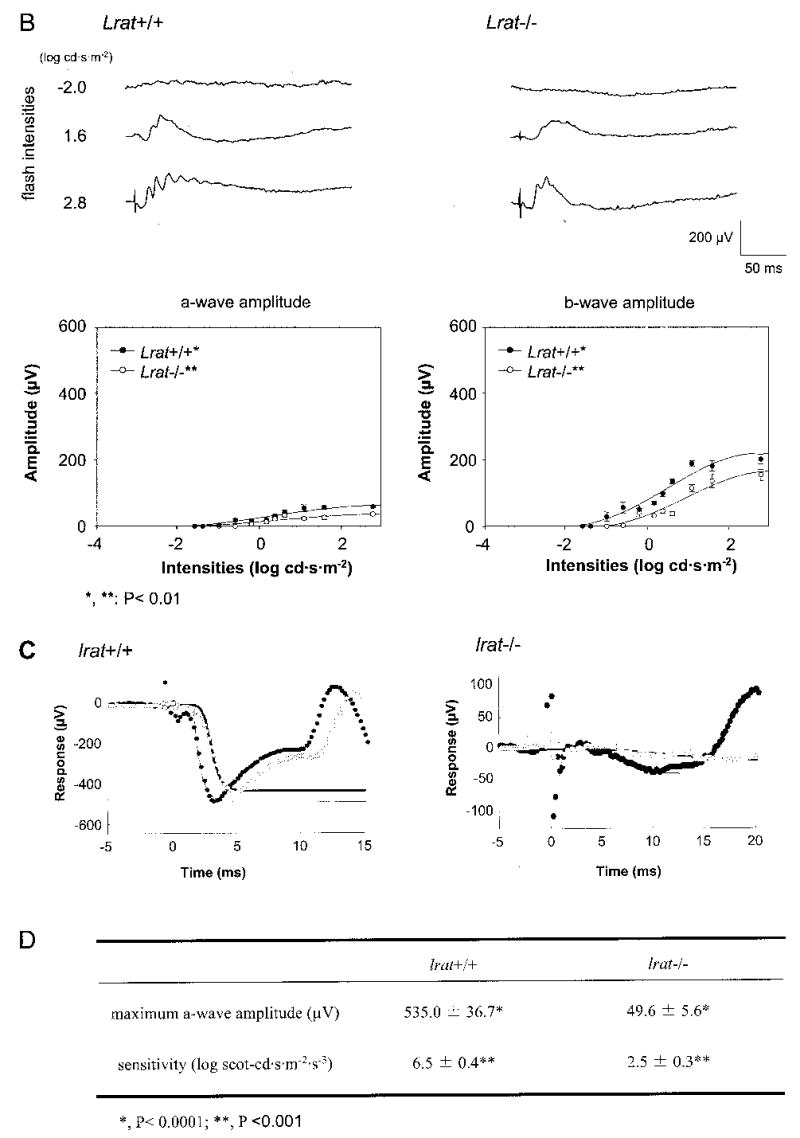
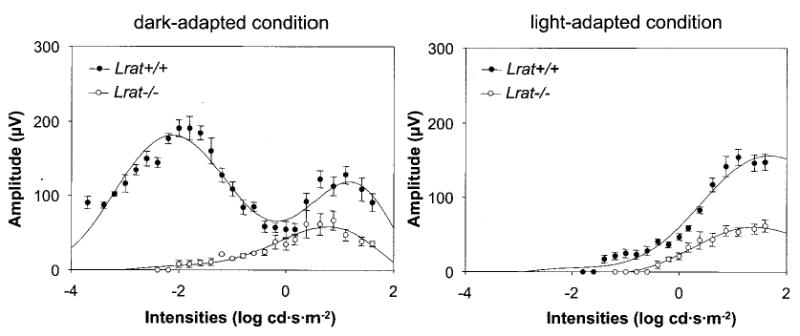
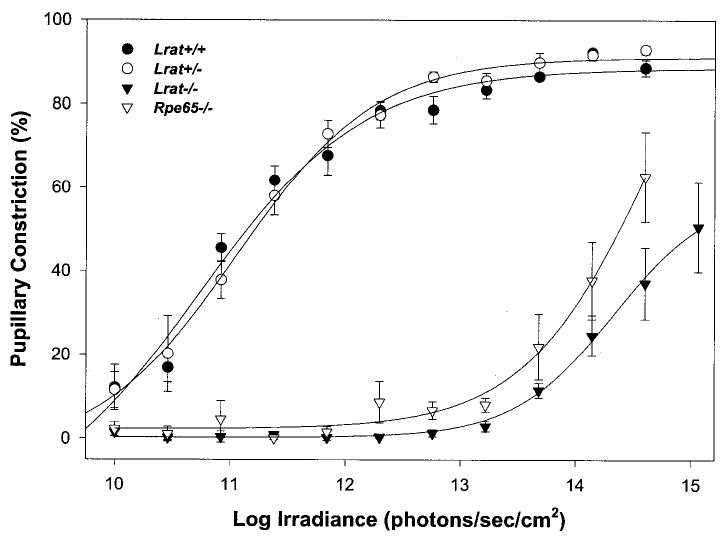
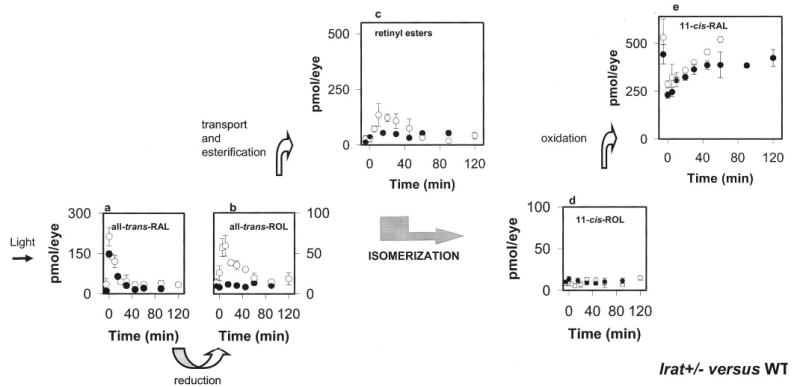
Lecithin-retinol acyltransferase (LRAT), an enzyme present mainly in the retinal pigmented epithelial cells and liver, converts all-trans-retinol into all-trans-retinyl esters. In the retinal pigmented epithelium, LRAT plays a key role in the retinoid cycle, a two-cell recycling system that replenishes the 11-cis-retinal chromophore of rhodopsin and cone pigments. We disrupted mouse Lrat gene expression by targeted recombination and generated a homozygous Lrat knock-out (Lrat-/-) mouse. Despite the expression of LRAT in multiple tissues, the Lrat-/- mouse develops normally. The histological analysis and electron microscopy of the retina for 6-8-week-old Lrat-/- mice revealed that the rod outer segments are approximately 35% shorter than those of Lrat+/+ mice, whereas other neuronal layers appear normal. Lrat-/- mice have trace levels of all-trans-retinyl esters in the liver, lung, eye, and blood, whereas the circulating all-trans-retinol is reduced only slightly. Scotopic and photopic electroretinograms as well as pupillary constriction analyses revealed that rod and cone visual functions are severely attenuated at an early age. We conclude that Lrat-/- mice may serve as an animal model with early onset severe retinal dystrophy and severe retinyl ester deprivation.


Figures

Fig. 1
Fig. 1. The mouse Lrat gene and the targeting construct
A, the mouse Lrat gene consists of two exons (black boxes) separated by a 6-kb intron. Relevant restriction sites present in the gene are: N, NaeI; Spe, SpeI; Xh, XhoI; K, KpnI; Av, AvrII; RV, EcoRV; H, HindIII; Pom, PspOMI. In the targeting construct, part of exon 1 including ATG is replaced by a Neo cassette. B, genotyping of Lrat+/+, Lrat+/−, and Lrat−/− mice. The wild-type Lrat gene fragment was amplified with primers LRAT1S and LRATWT1 yielding a ~300-bp product; the knock-out gene was amplified with primers LRAT1S and pgkNeo1, yielding a ~370-bp product. C, immunocytochemistry of Lrat+/+ and Lrat−/− mouse retina. Frozen sections of 8-week-old mice were probed with the monoclonal anti-Lrat antibody, generated as described under “Materials and Methods.” The specific response is present exclusively in the RPE cell layer in the eye of Lrat−/− mice. Scale bar, 50 μm. Inset, higher magnification of the RPE layer. Scale bar, 10 μm. D, immunoblotting of an extract from the Lrat mouse retina. The blot was developed using monoclonal anti-Lrat antibody.
Fig. 2
Fig. 2. Retina histology of Lrat−/− and WT mice
A and B, ROS thickness (in μm) plotted as a function of the retinal location (in mm) from the optic nerve head. The age of mice was 6 –8 postnatal weeks. Closed circles, Lrat+/+ mice; open circles, Lrat+/− mice; closed triangles, Lrat−/− mice. For details, see “Materials and Methods.” C, a representative crosssection (Nomarsky optics) of the retina from Lrat+/+ and Lrat−/− mice. Note that the ROS in the retina of Lrat−/− mice are ~35% shorter than those of Lrat+/+ mice. D, quantification of the thickness of different layers of the retina from WT (black bars) and Lrat−/− mice (gray bars) measured at 1.25 mm inferior from optic nerve head. OS, outer segment; IS, inner segment; ONL, outer nuclear layer; OPL, outer plexiform layer; INL, inner nuclear layer; IPL, inner plexiform layer; GCL, ganglion cell layer; PR, photoreceptor outer and inner segments; WR, whole retina.
Fig. 3
Fig. 3. Transmission EMs of the RPE and ROS
A and C, retina section of Lrat−/− mice. B and D, retina section of Lrat+/− mice. A and B show the cross-section of the RPE and the photoreceptor cells. C and D show a higher magnification of the synaptic terminal region of the photoreceptors cell. Arrows indicate the synaptic terminal of the photoreceptors cells. The preparation of sections is described under “Materials and Methods.” Note the shortening of ROS in Lrat−/− mice and disorganization of the synaptic terminals. Scale bars are 5 μm.
Fig. 4
Fig. 4. Chromatographic separation of nonpolar retinoids from Lrat mouse eyes
Retinoids were extracted from the eye and separated on normal phase HPLC as described under “Materials and Methods.” The peaks correspond to the following retinoids: 1, 13-cis-retinyl esters/11-cis-retinyl esters; 2, all-trans-retinyl esters; 3, 3′, syn-and anti-11-cis-retinal oximes; 4, 4′, syn- and anti-all-trans-retinal oximes; 5, 11-cis-retinol; 6, all-trans-retinol. * indicates artifacts related to a change in the solvent composition. Pure hexane was used as a control. Note that retinals are detected after conversion to oximes with NH2OH·HCl.
Fig. 5
Fig. 5. Chromatographic separation of nonpolar retinoids in the blood and liver from Lrat−/− mouse
A, liver; B, blood. Retinoids were extracted from the tissues and separated on normal phase HPLC. The peaks correspond to the following retinoids: 2, all-trans-retinyl esters; 6, all-trans-retinol. * indicates artifacts related to a change in the solvent composition or compounds unrelated to retinoids.
Fig. 6
Fig. 6. Single flash ERG responses of increasing intensity for Lrat−/− and Lrat+/+ mice
A and B, serial responses to increasing flash stimuli obtained from Lrat+/+ and Lrat−/− mice in dark-adapted (upper A panel) and light-adapted (upper B panel) conditions. Plotted ERG responses (a-wave and b-wave amplitudes) to increasing light stimuli in Lrat−/− show significantly lower responses compared with Lrat+/+ in both conditions (lower A panel, p < 0.0001; lower B panel, p < 0.01, one-way ANOVA). Light-adapted responses are examined after bleaching at 1.4 log cd·m−2 for 15 min. C, leading edges (initial 5–20 ms depending on response) of dark-adapted ERG photoresponses (symbols) evoked by 2.8-(filled circles) and 1.6-(open circles) log cd·s·m−2 flashes, are fit with a model of phototransduction (smooth lines). The amplitude and sensitivity of the Lrat−/− mouse photoresponses are reduced from maximal responses. D, maximum a-wave amplitude and sensitivity parameters of dark-adapted photoresponses in Lrat−/− mice compared with the results in Lrat+/+ mice. Lrat−/− mice show significant differences in both parameters (*, p < 0.0001; **, p < 0.001, one-way ANOVA) compared with Lrat+/+ mice. Error bars represent 1 S.E. in A and B.
Fig. 7
Fig. 7. Flicker ERG in Lrat−/− mice
Intensity-dependent response of 10-Hz flicker ERGs for Lrat−/− in dark-adapted (left panel) and light-adapted (right panel) condition. The flicker recordings were obtained with a range of intensities of −3.7–1.6 log cd·s·m−2 at a fixed frequency (10 Hz). Lrat−/− mice showed the threshold elevation with smaller amplitudes compared with Lrat+/+ mice. Light-adapted responses are examined after bleaching at 1.4 log cd·m−2 for 15 min.
Fig. 8
Fig. 8. Irradiance-response relationship for pupillary constriction in response to monochromatic 470 nm light
Percent pupillary constriction was calculated as 100*(1 − (minimum pupil area during 30-s light pulse/dark-adapted, prepulse pupil area)) (mean ± S.E.). Each curve was fitted via four-parameter sigmoidal regression analysis (SigmaPlot 2000). For Lrat+/+ mice, n was 5; Lrat+/− mice, n = 5; Lrat−/− mice, n = 10; Rpe65−/− mice, n = 5.
Fig. 9
Fig. 9. Kinetics of retinoid recovery in Lrat+/− and Lrat+/+ mice
A, mice were reared in the dark. HPLC retinoid analysis was performed either before or after a flash that bleached ~40% of the visual pigment. Photoactivated rhodopsin releases all-trans-retinal (RAL; a), which is reduced to all-trans-retinol (ROL; b), transported to the RPE, and then esterified to all-trans-retinyl esters (c). All-trans-retinol, or its derivative, is isomerized to 11-cis-retinol (d), which in turn is oxidized to 11-cis-retinal (e). Open circles and closed circles represent data obtained from Lrat+/− mice and Lrat+/+ mice, respectively. Error bars indicate the S.E. (n = 4 –8).

References

    1. Saari JC, Bredberg DL, Farrell DF. Biochem J. 1993;291:697–700. - PMC - PubMed
    1. Schmitt MC, Ong DE. Biol Reprod. 1993;49:972–979. - PubMed
    1. MacDonald PN, Ong DE. Biochem Biophys Res Commun. 1988;156:157–163. - PubMed
    1. Ong DE, MacDonald PN, Gubitosi AM. J Biol Chem. 1988;263:5789 –5796. - PubMed
    1. MacDonald PN, Ong DE. J Biol Chem. 1988;263:12478 –12482. - PubMed

Publication types

MeSH terms