. 2003 Dec 17;23(37):11554-67.
doi: 10.1523/JNEUROSCI.23-37-11554.2003.

Assembly of alpha4beta2 nicotinic acetylcholine receptors assessed with functional fluorescently labeled subunits: effects of localization, trafficking, and nicotine-induced upregulation in clonal mammalian cells and in cultured midbrain neurons

Affiliations

Assembly of alpha4beta2 nicotinic acetylcholine receptors assessed with functional fluorescently labeled subunits: effects of localization, trafficking, and nicotine-induced upregulation in clonal mammalian cells and in cultured midbrain neurons

Raad Nashmi et al. J Neurosci. .

Abstract

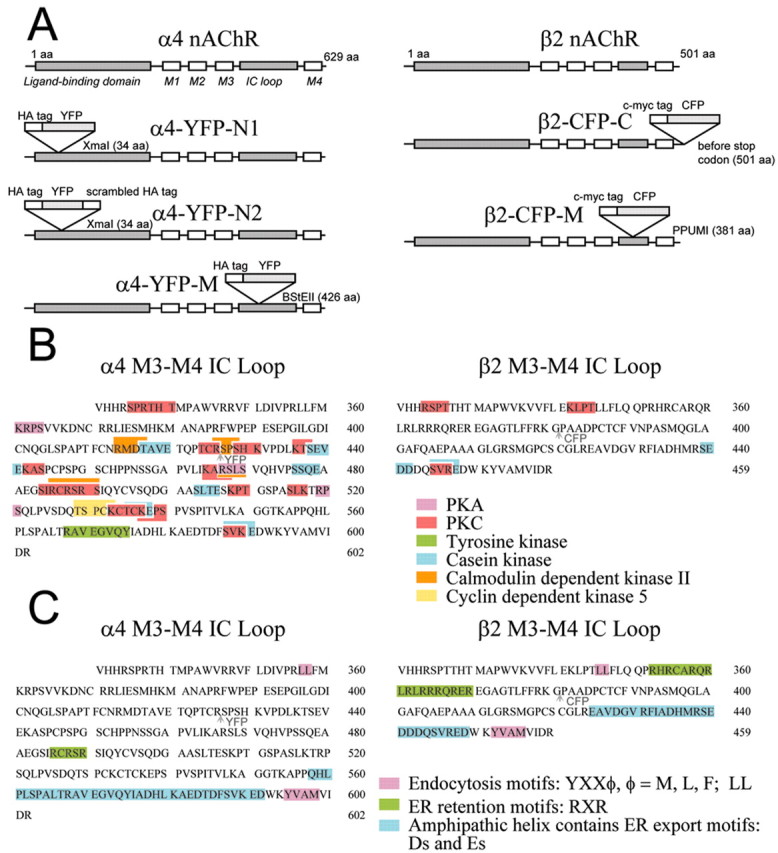
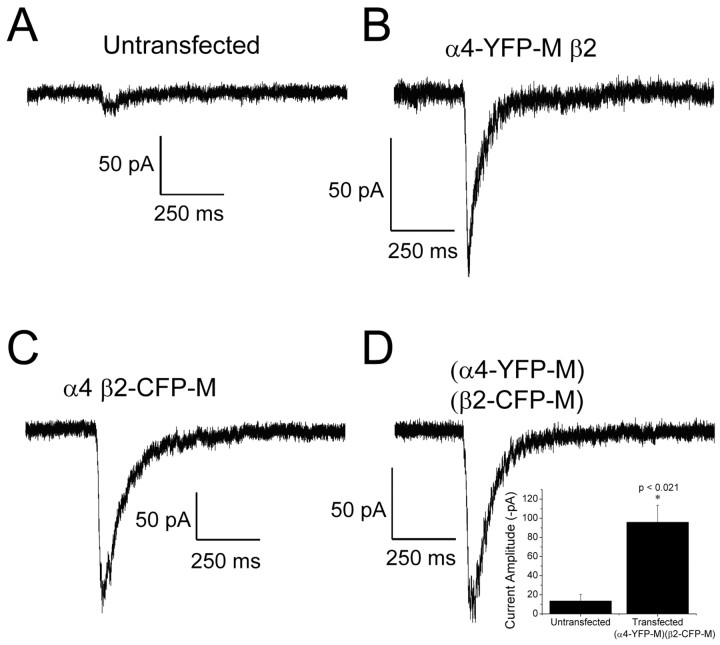
Fura-2 recording of Ca2+ influx was used to show that incubation in 1 microm nicotine (2-6 d) upregulates several pharmacological components of acetylcholine (ACh) responses in ventral midbrain cultures, including a MLA-resistant, DHbetaE-sensitive component that presumably corresponds to alpha4beta2 receptors. To study changes in alpha4beta2 receptor levels and assembly during this upregulation, we incorporated yellow and cyan fluorescent proteins (YFPs and CFPs) into the alpha4 or beta2 M3-M4 intracellular loops, and these subunits were coexpressed in human embryonic kidney (HEK) 293T cells and cultured ventral midbrain neurons. The fluorescent receptors resembled wild-type receptors in maximal responses to ACh, dose-response relations, ACh-induced Ca2+ influx, and somatic and dendritic distribution. Transfected midbrain neurons that were exposed to nicotine (1 d) displayed greater levels of fluorescent alpha4 and beta2 nicotinic ACh receptor (nAChR) subunits. As expected from the hetero-multimeric nature of alpha4beta2 receptors, coexpression of the alpha4-YFP and beta2-CFP subunits resulted in robust fluorescence resonance energy transfer (FRET), with a FRET efficiency of 22%. In midbrain neurons, dendritic alpha4beta2 nAChRs displayed greater FRET than receptors inside the soma, and in HEK293T cells, a similar increase was noted for receptors that were translocated to the surface during PKC stimulation. When cultured transfected midbrain neurons were incubated in 1 microm nicotine, there was increased FRET in the cell body, denoting increased assembly of alpha4beta2 receptors. Thus, changes in alpha4beta2 receptor assembly play a role in the regulation of alpha4beta2 levels and responses in both clonal cell lines and midbrain neurons, and the regulation may result from Ca2+-stimulated pathways.


Figures

Figure 1.
Figure 1.
Designs of fluorescently tagged α4 and β2 nAChR subunits. A, Nomenclature of the various α4-YFP and β2-CFP chimeric constructs and their diagrams illustrating the location of insertion of the fluorescent protein within the nAChR subunit. (1) YFP with an upstream HA epitope tag was inserted near the N terminus, three amino acids downstream after the putative signal sequence (α4-YFP-N1). (2) YFP with an upstream HA epitope tag and a downstream scrambled HA epitope tag was inserted near the N terminus, three residues downstream after the putative signal sequence (α4-YFP-N2). (3) YFP with an upstream HA epitope tag was inserted into BstEII restriction site of the M3-M4 loop at amino acid position 426 (α4-YFP-M). (4) CFP with an upstream c-myc epitope tag was inserted into PpuMI restriction site of the (M3-M4) loop at residue 381 (β2-CFP-M). (5) CFP with an upstream c-myc epitope tag was inserted one amino acid upstream of the terminal codon of β2 (β2-CFP-C). B, Putative phosphorylation motifs in the M3-M4 intracellular loops of α4 and β2. Phosphorylation motifs were from ScanProsite (http://ca.expasy.org/cgi-bin/scanprosite) and from Pearson and Kemp (1991). Locations of insertion of YFP and CFP in the cytoplasmic loop sequences of α4 andβ2, respectively, are indicated by arrowheads. C, Putative trafficking motifs in the M3-M4 intracellular loops of α4 and β2.
Figure 2.
Figure 2.
Whole-cell recordings and fura-2 recordings of Ca2+ accumulation for the various fluorescently tagged nicotinic receptor constructs expressed in HEK293T cells. ACh (300 μm) was applied every 60 sec (duration 50 msec). A, Exemplar ACh-induced currents of each of the fluorescently tagged chimeras. Currents were inhibited with continuous coapplication of the competitive antagonist DHβE (10 μm) and recovered during washing. B, Peak current response with 300 μm ACh of the fluorescently tagged and WT α4β2 receptors. Numbers represent mean ± SEM. Asterisks represent a significant difference (p < 0.05) as compared with WT. Ratiometric measurements (F340/F380) of fura-2 AM loaded in HEK293T cells show that intracellular calcium rises during a 5 sec application of 300 μm ACh for WT α4β2, α4-YFP-M β2, and α4 β2-CFP-M (C). Application of 300 μm ACh to cells expressing α4-YFP-N1 β2 and α4 β2-CFP-C showed no change in levels of intracellular calcium. Each trace represents a single cell. D, Box plot of peak calcium fluxes for each of the fluorescently labeled constructs. Bottom, middle, and top line of the box represents 25%, median, and 75%, respectively. Bottom error bar represents 5%, and the top error bar represents 95%. Asterisks represent a significant difference (p < 0.05) as compared with WT.
Figure 3.
Figure 3.
ACh dose-response relations for WT and fluorescently taggedα4β2 nAChRs. ACh dose-response relations for WT α4β2 (A), α4-YFP-M β2 (B), α4 β2-CFP-M (C), and (α4-YFP-M)(β2-CFP-M) (D) nicotinic receptor constructs. The top traces of each panel are the evoked currents (ACh in micromolar). The fluorescently tagged constructs resemble WT in their sensitivity to ACh.
Figure 4.
Figure 4.
Upregulation of nAChR functional responses by incubation in nicotine. Average of fura-2 recording traces of cultured ventral midbrain neurons at 2 d (A) and 4-6 d (C) after control or 1 μm nicotine treatment and elicited by a 300 μm pulse (2 sec) of ACh. Traces are shown for responses in the presence of no nicotinic receptor blockers (None) as well as MLA or (MLA + DHβE). Bar charts in B and D summarize the fura-2 changes in the plots above (A, C)at time points 2.75 and 4.75 sec after the start of ACh application for all of the conditions, with and without nicotinic receptor blockers, and with and without chronic nicotine incubation. Bar charts at day 2 show a significant increase in functional response in both the MLA- and DHβE-sensitive components with nicotine incubation (B). Days 4-6 show a significant upregulation in functional response of only the DHβE-sensitive nicotinic component (D).
Figure 5.
Figure 5.
Fluorescently tagged nicotinic receptors transfected in midbrain neurons produce agonist-induced currents. Recordings from neurons (embryonic day 14 <14 d in culture). A, Whole-cell recording in an untransfected neuron shows that 300 μm ACh (50 msec pulse duration) evokes small endogenous current (13 ± 7 pA). Whole-cell recordings of neurons transfected with the fluorescently labeled nicotinic receptors all show a significantly larger ACh-evoked current (B-D). Inset in D is a bar graph summarizing the results for neurons transfected with (α4-YFP)(β2-CFP) versus nontransfected.
Figure 6.
Figure 6.
Localization of α4β2 receptors in mecencephalic neurons. A-D, Projections of a confocal stack of images of midbrain neurons transfected with fluorescently labeled α4 or β2 nAChRs. α4 nAChRs are localized in the soma and dendrites (A, B, white arrowheads) and overlap with MAP2 (red) staining. α4 nAChRs are absent from axons as indicated by absence of staining in a process containing soluble nonfusion CFP (blue) but negative for MAP2 (B, yellow arrowheads). C, Also α4 nAChRs (green) do not overlap with the axonal marker dephosphorylated tau (C, red). D, β2 nAChRs (green) are also found in soma and dendrites (white arrowheads) of neurons (red). E, Wide-field fluorescence images of untransfected midbrain neurons that are stained with anti-α4 antibody show similar staining of endogenous α4 nAChRs located primarily in soma and dendrites. F, Tyrosine hydroxylase immunoreactivity identifies one of the α4-containing neurons as dopaminergic.
Figure 7.
Figure 7.
Incubation in nicotine upregulates levels of α4 nAChR subunits. We followed the expression levels of fluorescently labeled α4 nAChR subunits in individual identified midbrain neurons twice, once before and once 24 hr after treatment in either control or nicotine solution. A, Images show α4-YFP fluorescence in nicotine and control treated neurons at 0 and 1 d after treatment. A ramp of grayscale values is indicated below each image pair. The decrease of fluorescence in the control cell (left-hand panel) was larger than average. B, Bar graphs showing that nicotine (1 μm) treatment resulted in a significant increase (∼143%) in α4-YFP subunit expression in dendrites and a smaller relative increase (∼115%) in soma of cultured neurons.
Figure 8.
Figure 8.
FRET between (α4-YFP-M) (β2-CFP-M) subunits transfected in HEK293T cells and translocation of assembled α4β2 receptors by C kinase. A, Confocal images showing greater dequenching of CFP in 1 μm PMA-treated cells than in untreated cells during YFP photobleaching. PMA-treated cells also show stronger fluorescence intensity of α4β2 nAChRs near the cell surface membrane. B, PMA-treated cells show larger ACh-induced currents than untreated cells. Plots of YFP and CFP intensities during photobleaching in untreated (C, E) and PMA-treated cells (D, F). Scatterplot (G) and bar graphs (H) show that PMA-treated cells display greater FRET than untreated cells. The slopes were used to calculate FRET efficiency (H), which was significantly greater in the PMA-treated cells than the untreated cells.
Figure 10.
Figure 10.
Dendritic α4β2 receptors display greater FRET than somatic receptors. FRET between (α4-YFP-M)(β2-CFP-M) subunits transfected in ventral midbrain neurons. A, Images showing increases in CFP fluorescence over time, whereas YFP fluorescence decreases with photobleaching. B-E, Plots of percentage of intensity change in CFP and YFP fluorescence over photobleaching time of YFP indicate greater dequenching of CFP between (α4-YFP-M)(β2-CFP-M) subunits expressed in dendrites as compared with soma. Scatterplot (F) and bar chart (G) show greater FRET in dendrites than soma in neurons. The slopes of the scatterplots were used to calculate FRET efficiency (G) between α4 and β2, which was significantly greater in dendrites than soma. Therefore, α4β2 receptors in dendrites show a higher degree of assembly than in the soma.
Figure 9.
Figure 9.
Lack of FRET between GluClα and α4 nAChR subunits. A, Confocal images showing dequenching of CFP between (GluClβ-YFP)(GluClα-CFP) and not between (α4-YFP-M)(GluClα-CFP) during YFP photobleaching. Plots of YFP and CFP intensities during photobleaching in cells with (α4-YFP-M)(GluClα-CFP) (B, D) and cells with (GluClβ-YFP)(GluClα-CFP) (C, E). F, Scatterplot showing absence of FRET with (α4-YFP-M)(GluClα-CFP) but presence of FRET between (GluClβ-YFP)(GluClα-CFP). The slopes were used to calculate FRET efficiency (G).
Figure 11.
Figure 11.
Incubation in nicotine increases FRET in the soma. FRET between (α4-YFP-M)(β2-CFP-M) subunits transfected in ventral midbrain neurons. A, Images showing increases in CFP fluorescence over time, whereas YFP fluorescence decreases with photobleaching. B-E, Plots of percentage of intensity change in CFP and YFP fluorescence over photobleaching time of YFP indicate greater dequenching of CFP between (α4-YFP-M)(β2-CFP-M) subunits expressed in soma of neurons exposed to nicotine as compared with unexposed controls. Scatterplot (F) and bar chart (G) show greater FRET and therefore greater α4β2 subunit assembly in the soma of nicotine-incubated neurons as compared with the soma of unexposed control neurons.

References

    1. Alkondon M, Albuquerque EX ( 2002) A non-alpha7 nicotinic acetylcholine receptor modulates excitatory input to hippocampal CA1 interneurons. J Neurophysiol 87: 1651-1654. - PubMed
    1. Arroyo-Jimenez MD, Bourgeois JP, Marubio LM, Le Sourd AM, Ottersen OP, Rinvik E, Fairen A, Changeux JP ( 1999) Ultrastructural localization of the α4-subunit of the neuronal acetylcholine nicotinic receptor in the rat substantia nigra. J Neurosci 19: 6475-6487. - PMC - PubMed
    1. Banerjee C, Nyengaard JR, Wevers A, de Vos RA, Jansen Steur EN, Lindstrom J, Pilz K, Nowacki S, Bloch W, Schroder H ( 2000) Cellular expression of α7 nicotinic acetylcholine receptor protein in the temporal cortex in Alzheimer's and Parkinson's disease-a stereological approach. Neurobiol Dis 7: 666-672. - PubMed
    1. Bertrand D, Picard F, Le Hellard S, Weiland S, Favre I, Phillips H, Bertrand S, Berkovic SF, Malafosse A, Mulley J ( 2002) How mutations in the nAChRs can cause ADNFLE epilepsy. Epilepsia 43: 112-122. - PubMed
    1. Breese CR, Marks MJ, Logel J, Adams CE, Sullivan B, Collins AC, Leonard S ( 1997) Effect of smoking history on [3H]nicotine binding in human postmortem brain. J Pharmacol Exp Ther 282: 7-13. - PubMed

Publication types

MeSH terms