. 2003 Dec 17;23(37):11725-31.
doi: 10.1523/JNEUROSCI.23-37-11725.2003.

Stimulation in hippocampal region CA1 in behaving rats yields long-term potentiation when delivered to the peak of theta and long-term depression when delivered to the trough

Affiliations

Stimulation in hippocampal region CA1 in behaving rats yields long-term potentiation when delivered to the peak of theta and long-term depression when delivered to the trough

James M Hyman et al. J Neurosci. .

Abstract

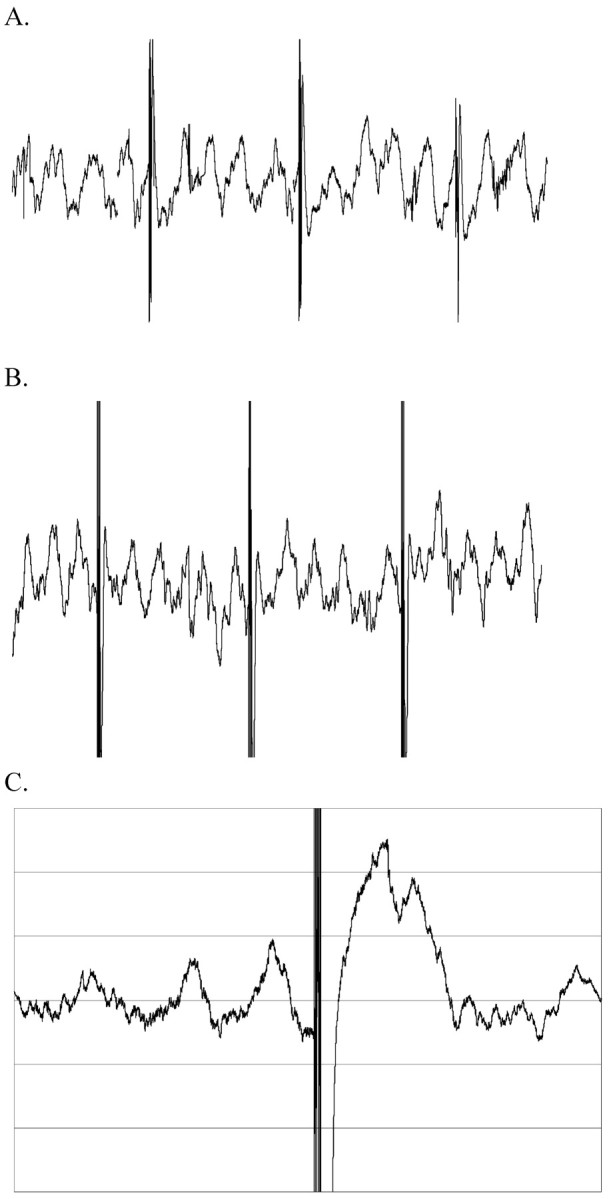
Experimental evidence suggests that the hippocampal theta rhythm plays a critical role in learning. Previous studies have shown long-term potentiation (LTP) to be preferentially induced with stimulation on the peak of local theta rhythm in region CA1 in anesthetized rats and with stimulation of the perforant path at the peak of theta in both anesthetized and behaving animals. We set out to determine the effects of tetanic burst stimulation in stratum radiatum of region CA1 in awake behaving animals, delivered during either the peak or the trough of the theta rhythm in the EEG. Bursts delivered to the peak resulted in an increase of 17.9 +/- 0.94% in potential slope. When identical stimulation bursts were delivered to the trough of local theta waves, the potential slope decreased 12.9 +/- 1.03%. This is the first report of LTP being preferentially induced at the peak of local theta rhythm in behaving animals in region CA1 and that LTD was found in response to tetanic stimulation at the trough of the local theta wave. The results are discussed within the framework of a recent theory that proposes that the theta rhythm sets the dynamics for alternating phases of encoding and retrieval (Hasselmo et al., 20021).


Figures

Figure 1.
Figure 1.
Dual-window discrimination. Dual-window discrimination used for detecting theta and delivering the tetanus to the appropriate phase. The discriminator created two windows with variable widths (time span) and independently adjustable heights (amplitude) on a standalone oscilloscope. The time offset between the two windows was also adjustable. By adjusting the windows to fit each individual animal's typical theta frequency and amplitude, we were able to tetanize on the peak or trough of theta accurately. If the input waveform successfully passed through both windows, a trigger was immediately sent to the stimulator. The delivery of the tetanus could then be manipulated, via digital delay on the stimulator, to fall on the next peak or trough. The appearance of the tetanic stimulation on the EEG provided accurate phase information for later analysis.
Figure 2.
Figure 2.
Tetanus delivery. A, B, A representative example of three high-frequency bursts delivered to the peak of the theta wave (A) and to the trough of the theta wave (B). C, The graph shows an average of the EEG (n = 21; 3 bursts per 7 animals) for 500 msec, centered on the first pulse of the tetanic burst. The average reveals two to three cycles of a theta rhythm before the tetanic burst, indicating a consistent phase relationship for each tetanic burst.
Figure 3.
Figure 3.
A, Effects of peak or trough tetanic stimulation on group means for slope (shaded) and amplitude (white). Series 1 and 2 are for peak stimulation sessions (n = 8), and series 3 and 4 are for trough stimulations (n = 7). Error bars are SE (*p < 0.001). B, The effects of peak or trough tetanic stimulation on amplitude group means for a 30 min baseline period and 30 min after delivery of three tetanic bursts. Peak stimulation sessions are shown with squares, and trough stimulation sessions are shown with triangles. Peak stimulation sessions consistently revealed a consistent increase in evoked potential amplitude for 30 min after the tetanic bursts, whereas trough stimulation consistently revealed a lasting depression of the evoked potential amplitude for 30 min after the tetanic bursts. Each data point represents the average across animals for 4 min periods, normalized to percentage change from baseline.
Figure 4.
Figure 4.
Representative examples of the effect of peak and trough tetanic stimulation. A, The graph shows the change in synaptic potential caused by three bursts of high-frequency stimulation to the peak of theta. Points are evoked potential slope (volts per millisecond) taken once every 20 sec for 30 min before and after tetanic stimulation (total time plotted, 60 min). The dotted line is the average evoked potential slope for the baseline-pretetanus period. In the inset are averaged waveforms for the baseline period (left) and the post-tetanus period (right). In this representative session of peak tetanic stimulation, the averaged waveforms show a clear difference in evoked potential slope and peak amplitude, with the post-tetanic potentials having a steeper slope and larger peak. B, The graph shows the results of three bursts of high-frequency stimulation to the trough of theta. Again, points are evoked potential slope (volts per millisecond) taken at the same time intervals. The dotted line is the average evoked potential slope for the baseline-pretetanus period. The inset shows average waveforms for baseline (left) and post-tetanus (right) periods. For this representative session of trough tetanic stimulation, the post-tetanic potentials were consistently lower in peak amplitude and slope, and those differences can be seen in the averaged waveforms. The arrows show the point in time the tetanic bursts were delivered.

References

    1. Berry SD, Seager MA ( 2001) Hippocampal theta oscillations and classical conditioning. Neurobiol Learn Mem 76: 298-313. - PubMed
    1. Brankack J, Stewart M, Fox SE ( 1993) Current source density analysis of the hippocampal theta rhythm: associated sustained potentials and candidate synaptic generators. Brain Res 615: 310-327. - PubMed
    1. Brown TH, Chapman PF, Kairiss EW, Keenan CL ( 1988) Long-term synaptic potentiation. Science 242: 724-728. - PubMed
    1. Buzsaki G, Leung LW, Vanderwolf CH ( 1983) Cellular bases of hippocampal EEG in the behaving rat. Brain Res 287: 139-171. - PubMed
    1. Cummings JA, Mulkey RM, Nicoll RA, Malenka RC ( 1996) Ca2+ signaling requirements for long-term depression in the hippocampus. Neuron 16: 825-833. - PubMed

Publication types

LinkOut - more resources