. 2004 Jan 14;23(1):221-33.
doi: 10.1038/sj.emboj.7600028. Epub 2003 Dec 18.

migS, a cis-acting site that affects bipolar positioning of oriC on the Escherichia coli chromosome

Affiliations

migS, a cis-acting site that affects bipolar positioning of oriC on the Escherichia coli chromosome

Yoshiharu Yamaichi et al. EMBO J. .

Abstract

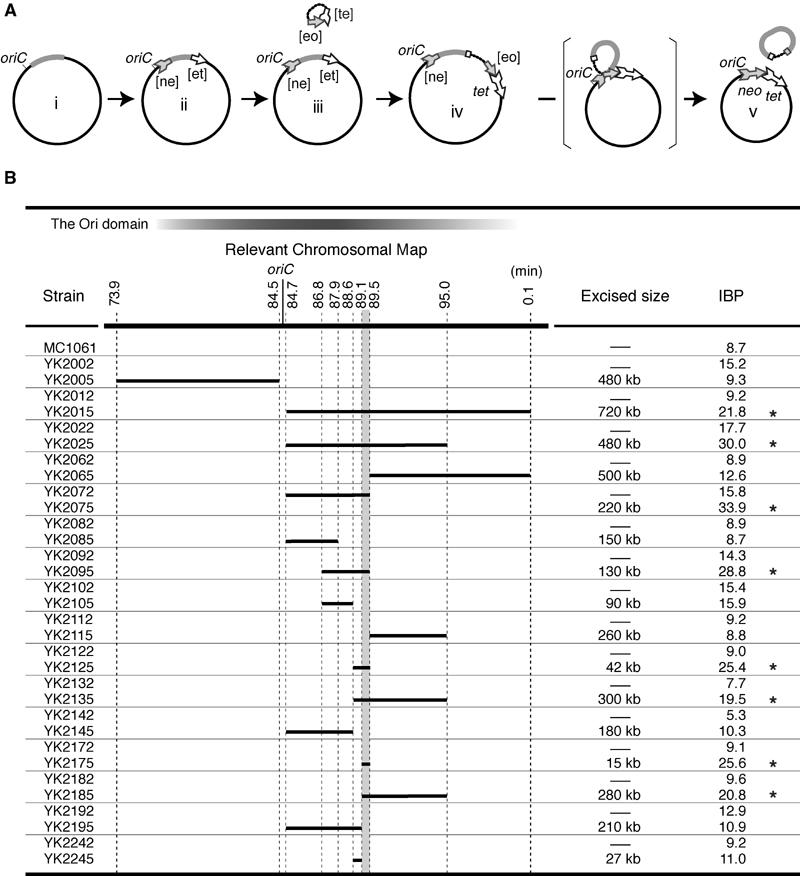
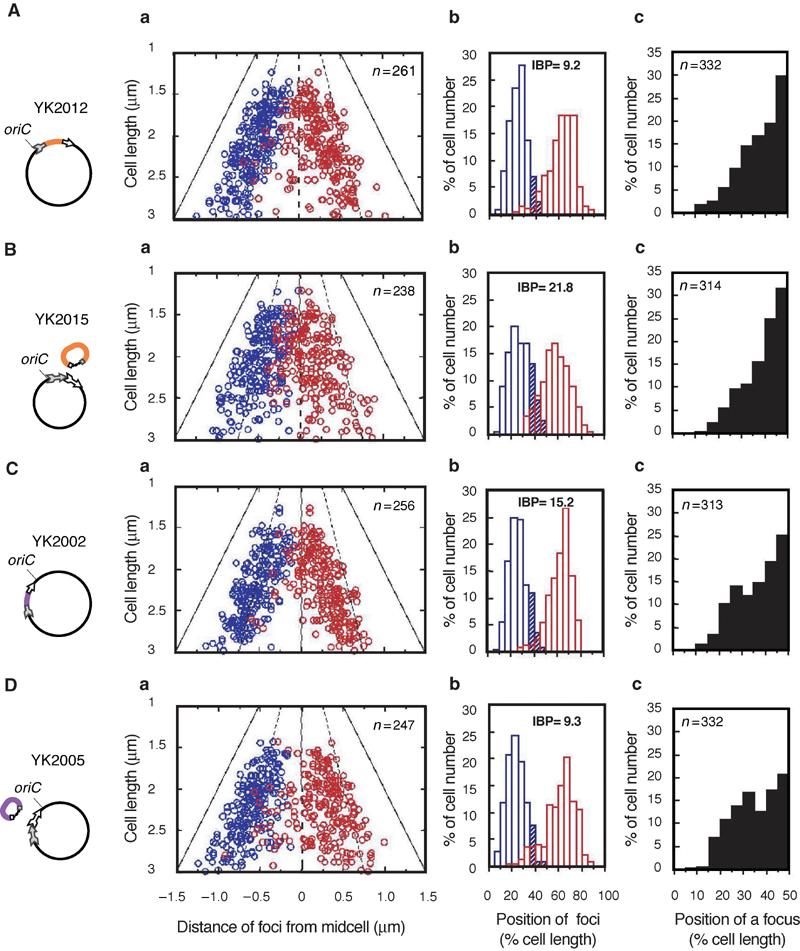
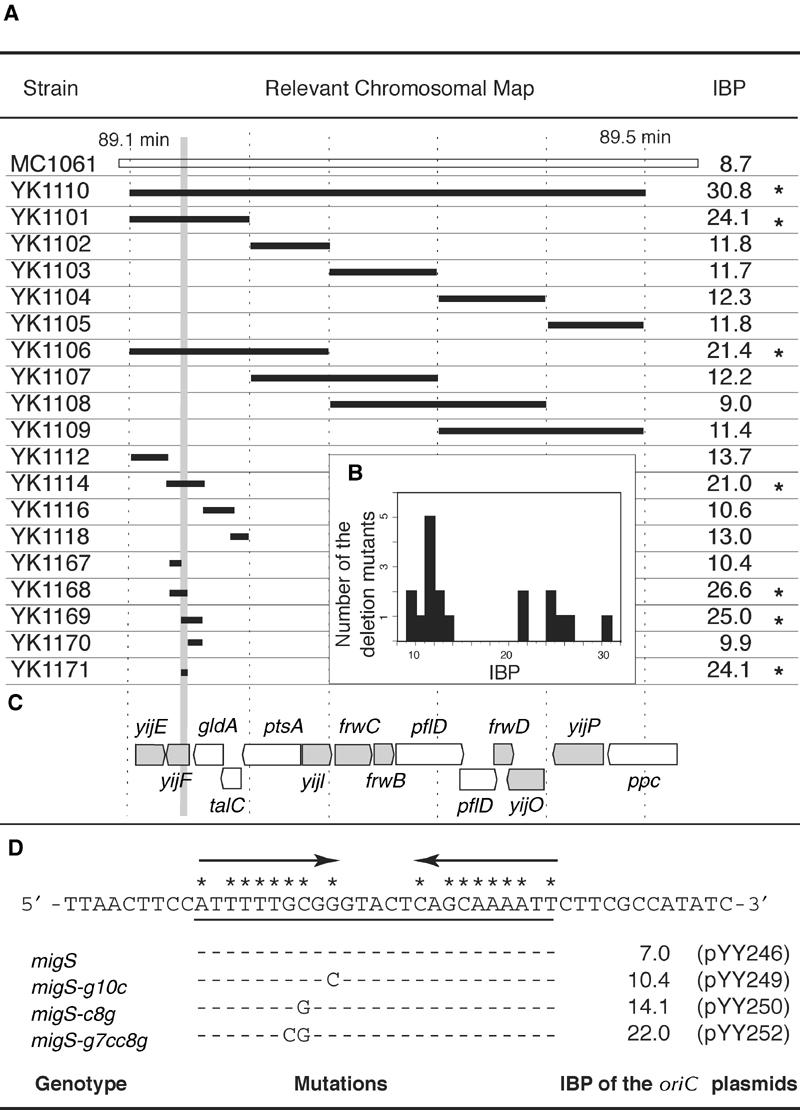
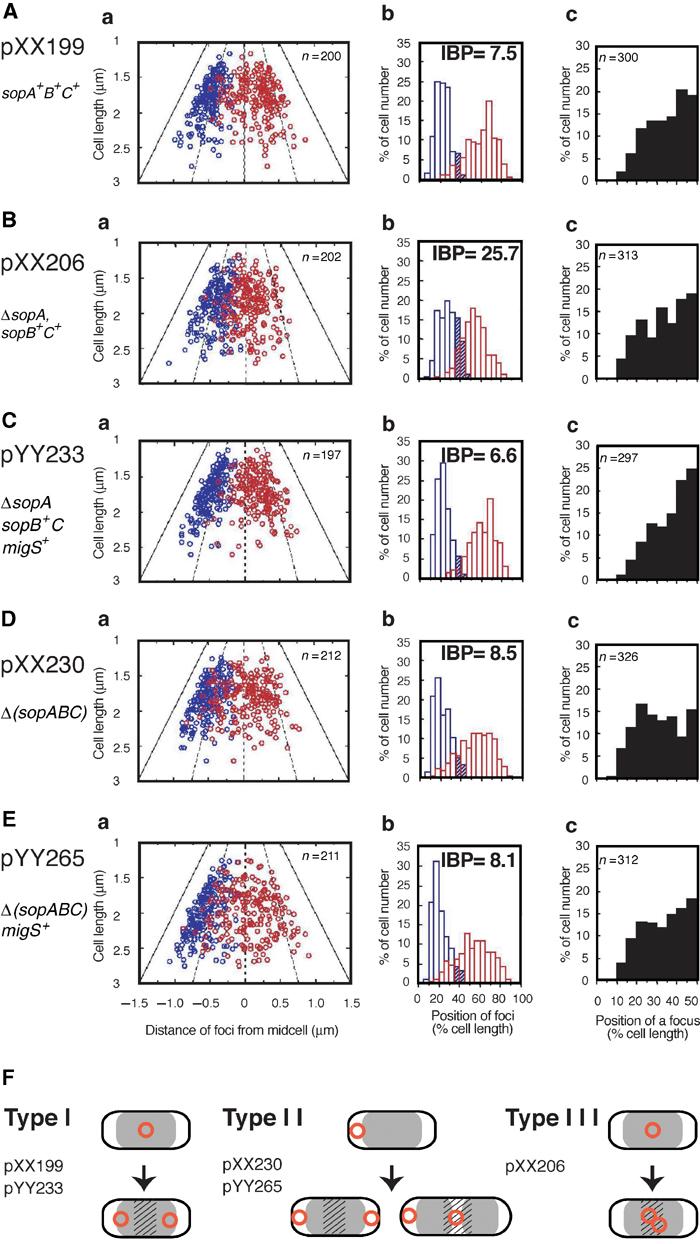
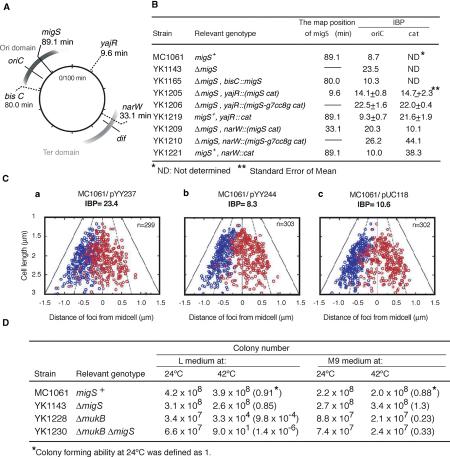
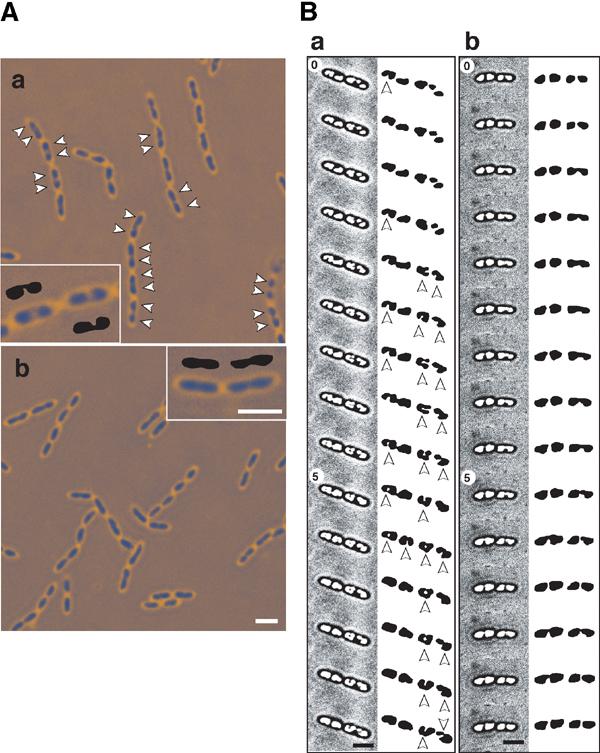
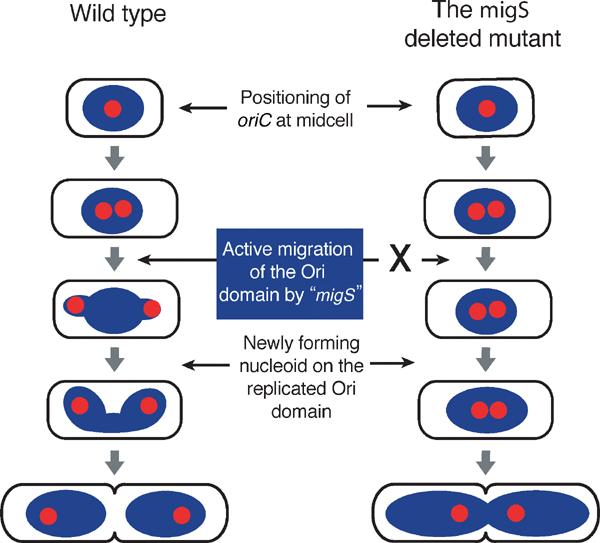
During replication of the Escherichia coli chromosome, the replicated Ori domains migrate towards opposite cell poles, suggesting that a cis-acting site for bipolar migration is located in this region. To identify this cis-acting site, a series of mutants was constructed by splitting subchromosomes from the original chromosome. One mutant, containing a 720 kb subchromosome, was found to be defective in the bipolar positioning of oriC. The creation of deletion mutants allowed the identification of migS, a 25 bp sequence, as the cis-acting site for the bipolar positioning of oriC. When migS was located at the replication terminus, the chromosomal segment showed bipolar positioning. migS was able to rescue bipolar migration of plasmid DNA containing a mutation in the SopABC partitioning system. Interestingly, multiple copies of the migS sequence on a plasmid in trans inhibited the bipolar positioning of oriC. Taken together, these findings indicate that migS plays a crucial role in the bipolar positioning of oriC. In addition, real-time analysis of the dynamic morphological changes of nucleoids in wild-type and migS mutants suggests that bipolar positioning of the replicated oriC contributes to nucleoid organization.


Figures

Figure 1
Figure 1
Construction and characterization of the chromosomal split mutants. (A) Schematic diagram of the construction of chromosomal split mutants. All chromosomal split mutants are derived from MC1061. The chromosomal segment to be excised is drawn in gray (i). The [ne] cassette (gray arrow tail) and the [et] cassette (white arrowhead) were inserted into the desired endpoints of the chromosomal segment to be excised. The [ne] cassette includes a neomycin- resistant gene (neo) that is deleted at the 3′-end. The [et] cassette includes a tetracyclin-resistant gene (tet) that is deleted at the 5′-end (ii). A low copy-number plasmid carrying both the [eo] cassette (gray arrowhead) and the [te] cassette (white arrow tail) was introduced. The [eo] cassette includes the neo gene that is deleted at the 5′-end. The [te] cassette is the tet gene that is deleted at the 3′-end (iii). Homologous recombination between the [te] and the [et] cassette generated a complete tetracyclin-resistant gene and simultaneously the plasmid was integrated into the chromosome (iv). Homologous recombination between the [ne] and the [eo] cassette generated a complete neomycin-resistant gene and simultaneously a subchromosome (v). (B) Chromosomal split mutants and their activity for bipolar migration of oriC. A series of chromosomal segments that were split from the original chromosome are shown as bold bars, with the E. coli chromosome map between 73.9 and 0.1 min (thick bold line). The chromosomal region including oriC nearly corresponds to the Ori domain (Niki et al. 2000), which is indicated in a bar above the chromosomal map. The IBP is the frequency of cells with two fluorescence foci located within the middle of cells, which was defined as the area between 35 and 65% of the cell length in arbitrary units. Asterisks indicate the chromosomal split mutants with significantly increased values in IBP, which are more than 18.7 (mean+2 × s.d., see the text). The chromosomal segment common to the chromosomal split mutants with higher IBP is indicated in gray.
Figure 2
Figure 2
Subcellular localization of the oriC segment before or after chromosomal splitting. The oriC segments on the chromosome were detected by the FISH method, and the positions of oriC foci were measured in cells with two foci or one focus. (A) YK2012, (B) YK2015, (C) YK2002, (D) YK2005. Schematic diagrams indicate the physical state of the chromosome and the split subchromosome: split chromosomal segments (colored lines), and the cassettes (arrows). (a) Cells with two fluorescent foci were statistically analyzed. The positions of oriC foci from the midcell are plotted versus cell length. The focus closest to a pole is shown in blue. The distance of the other focus from the same pole was measured (red). The broken lines indicate the 1/4 and 3/4 positions of cell length, and the solid lines indicate the position of a cell pole. The thin lines indicate midcell points. (b) The histogram shows the distribution frequency of the foci. The hatched areas correspond to values of the IBP. (c) Cells with a single fluorescent focus were statistically analyzed and the distribution frequency of the foci is shown in the histogram.
Figure 3
Figure 3
Bipolar positioning of oriC in various chromosomal deletion mutants. (A) Systematic chromosomal deletion mutants were constructed within the 15 kb segment between 89.1 and 89.5 min. Deleted segments are shown as bold bars on the chromosome map (white bar). The exact endpoints of deleted segments are described in Supplementary Table I. The chromosomal segment common to the deletion mutants with higher IBP is indicated in gray. Asterisks indicate the chromosomal split mutants with significantly increased values in IBP (see the text). (B) Histogram of the distribution frequency of the IBP among the deletion mutants. (C)Coding regions on the chromosomal segment between 89.1 and 89.5 min. Genes estimated from the nucleotide sequence are indicated in gray. (D) The deleted chromosomal segment in YK1171 is a 46 bp nucleotide sequence. Arrows indicate an imperfect inverted repeat. Matched nucleotides are shown by an asterisk. Point mutations are showed with the IBP of the oriC plasmids that have the corresponding migS sequence with or without the mutations.
Figure 4
Figure 4
Subcellular localization of the oriC plasmids. The positions of fluorescent foci were measured in cells with one focus or two foci of various oriC plasmids: (A) pXX199, (B) pXX206, (C) pYY233, (D) pXX230, (E) pYY265. Cells with two fluorescent foci were statistically analyzed. The positions of fluorescent foci are shown by scatter diagram (a) or histogram (b) as described in Figure 2. (c) Cells with one fluorescent focus were statistically analyzed and the distribution frequency of the foci is shown in the histogram. (F) Schematic diagrams indicate the subcellular localization patterns of plasmid DNA molecules (circles) in a cell: nucleoids (gray) and subcellular areas that are 35–65% of the cell length (hatch).
Figure 5
Figure 5
Characterization of migS. (A) A map indicates various chromosomal locations where migS is placed on. (B) Effect of placed migS on bipolar positioning of the chromosomal segment. The IBP of oriC on the chromosome and the chromosomal segment including the cat gene are indicated. The standard errors were calculated on three independent experiments. (C) Effect of high copy-number migS plasmid on bipolar positioning of oriC on the chromosome. The positions of oriC foci were measured in cells with two fluorescent foci and shown by scatter diagram: (a) cells harboring pYY237 (migS); (b) cells harboring pYY244 (migS-g7cc8g); (c) cells harboring pUC118 (a vector). (D) Colony-forming ability of a cell with the double null mutations of mukB and migS, depending on growth temperature and culture medium.
Figure 6
Figure 6
Microscope images of a living cell in gelatin-containing medium. (A) Nucleoids in cells were grown to mid-log phase at 30°C in M9 medium. Living cells were mounted in 23% gelatin-containing medium to detect chromosomal DNA. Cells were shown in phase-contrast images with pseudo-coloring. (a) MC1061 (wild type), (b) YK1143 (ΔmigS). Arrowheads indicate two discrete nucleoids in an elongated cell (>2 μm) without constriction. Typical nucleoids in an elongated cell (>2 μm) without constriction were indicated in inside panels with diagrams of extracted nucleoids. Scale bar represents 2 μm. (B) Time-lapse microscopy of a living cell mounted in gelatin. Cells pre-incubated in L medium with 0.2% glucose at 30°C were transferred to a dish with a coverslip and mounted in 23% gelatin-containing L medium with 0.2% glucose. The phase-contrast pictures were taken at 30 s intervals: (a) MC1061 (wild type), (b) YK1143 (ΔmigS). The numbers correspond to minutes in the frames of time-lapse imaging. The images were improved in the nucleoid outline using the “equalization” treatment of Adobe Photoshop ver. 7. Extracted nucleoids are shown as diagrams on the right side with magnification (1.5 ×). Arrowheads indicate lobed nucleoids. The original images were shown in Supplementary Figure 3. Scale bar represents 2 μm.
Figure 7
Figure 7
Model of the oriC bipolar migration/positioning and nucleoids formation. In a wild-type cell growing slowly, the oriC segment is replicated at midcell. The replicated oriC segments migrate towards the cell quarters, dependent on the function of migS located near oriC. After migration by migS, the Ori domains of the chromosome including the replicated oriC segment and the adjacent chromosomal segments localize at or near the cell quarters. The Ori domains are newly folded to make discrete sub-nucleoids, and a whole nucleoid looks like a dumbbell. The highly organized chromosome structure is presumably involved in tethering the Ori domain at or near the cell quarters. On the other hand, in the migS deleted mutant, bipolar positioning of the replicated oriC segments is defective because of the loss of putative active migration by migS. As the replicated oriC segments and the adjacent chromosomal segments still localize at the midcell, newly forming nucleoids are not discrete. However, the chromosome condensation by the MukB protein at the cell quarters (Ohsumi et al, 2001) may compensate for the defect in the formation of discrete nucleoids, and nucleoids are clearly separated before septum closing. The shared masses represent the E. coli nucleoids, or organized chromosomes in a cell; red circles indicate replication origin, oriC. migS is located near oriC.

References

    1. Ben-Yehuda S, Rudner DZ, Losick R (2003) RacA, a bacterial protein that anchors chromosomes to the cell poles. Science 299: 532–536 - PubMed
    1. Datsenko KA, Wanner BL (2000) One-step inactivation of chromosomal genes in Escherichia coli K-12 using PCR products. Proc Natl Acad Sci USA 97: 6640–6645 - PMC - PubMed
    1. Davis MA, Austin SJ (1988) Recognition of the P1 plasmid centromere analog involves binding of the ParB protein and is modified by a specific host factor. EMBO J 7: 1881–1888 - PMC - PubMed
    1. Draper GC, Gober JW (2002) Bacterial chromosome segregation. Annu Rev Microbiol 56: 567–597 - PubMed
    1. Edwards DH, Errington J (1997) The Bacillus subtilis DivIVA protein targets to the division septum and controls the site specificity of cell division. Mol Microbiol 24: 905–915 - PubMed

Publication types