

Tumor necrosis factor alpha enhances Actinobacillus actinomycetemcomitans leukotoxin-induced HL-60 cell apoptosis by stimulating lymphocyte function-associated antigen 1 expression
- PMID: 14688105
- PMCID: PMC343981
- DOI: 10.1128/IAI.72.1.269-276.2004
Tumor necrosis factor alpha enhances Actinobacillus actinomycetemcomitans leukotoxin-induced HL-60 cell apoptosis by stimulating lymphocyte function-associated antigen 1 expression
Abstract
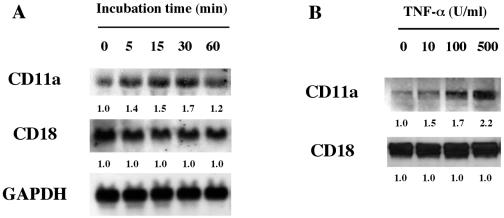
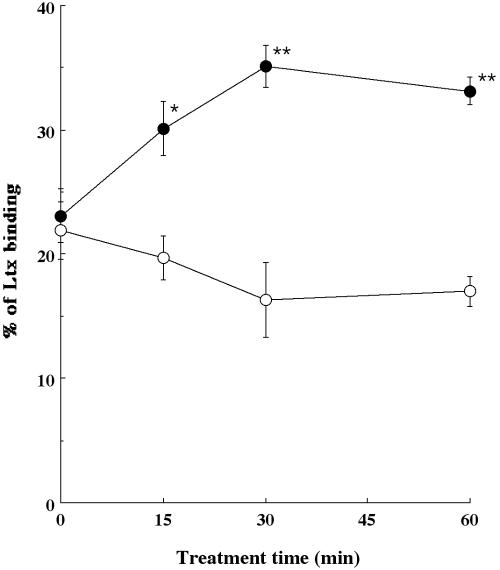
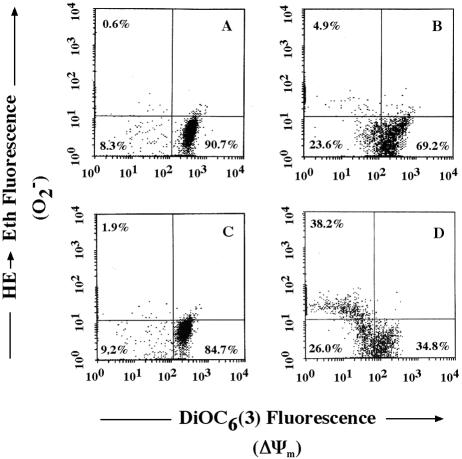
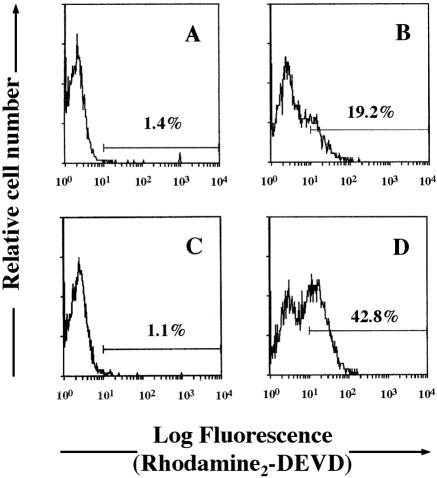
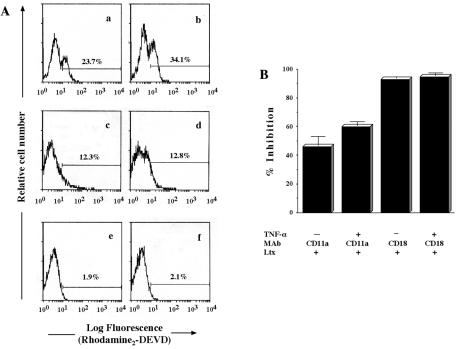
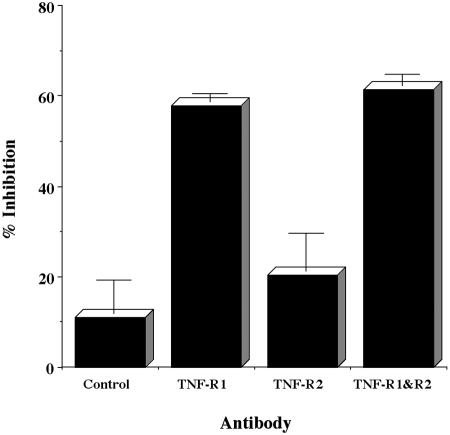
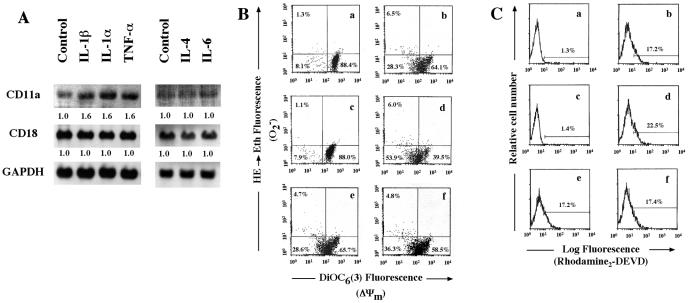
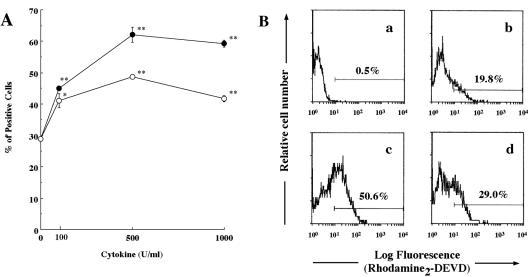
We demonstrated previously that Actinobacillus actinomycetemcomitans leukotoxin (Ltx) is greatly able to induce apoptotic signaling in cells that are positive for lymphocyte function-associated antigen 1 (LFA-1), a cell receptor of Ltx. We investigated in this study whether inflammatory cytokines can regulate apoptosis of human leukemic HL-60 cells induced by Ltx. Of the cytokines tested, tumor necrosis factor alpha (TNF-alpha) significantly enhanced the Ltx-induced cell apoptosis. Northern and Western blotting analyses showed that TNF-alpha enhanced the expression of CD11a in the cells at both the mRNA and protein levels but did not do so for CD18 expression. TNF-alpha also enhanced the binding of Ltx to the cells. We also observed by measuring the mitochondrial transmembrane potential and the generation of superoxide anion that the cytokine enhanced Ltx-induced apoptosis in HL-60 cells. In addition, interleukin-1beta significantly enhanced Ltx-induced cell apoptosis, although the enhancing activity was lower than that of TNF-alpha. These stimulatory effects of both cytokines were also observed for human polymorphonuclear leukocytes. The ability of TNF-alpha to increase cell susceptibility to Ltx could be inhibited by preincubation of the cells with a monoclonal antibody against TNF receptor 1 but not by preincubation of the cells with a monoclonal antibody against anti-TNF receptor 2. Furthermore, the results of an assay of caspase 3 intracellular activity (PhiPhiLuxG1D2) showed that Ltx-induced caspase 3 activation was completely neutralized by CD18 antibody treatment, although significant neutralization was also observed with anti-CD11a antibody. Taken together, the results of the present study indicate that TNF-alpha acts as a potent stimulator of Ltx-induced HL-60 cell apoptosis via TNF receptor 1-mediated upregulation of LFA-1 expression.
Figures
Similar articles
-
Inflammatory cytokines enhance the interaction of Mannheimia haemolytica leukotoxin with bovine peripheral blood neutrophils in vitro.Infect Immun. 2002 Aug;70(8):4336-43. doi: 10.1128/IAI.70.8.4336-4343.2002. Infect Immun. 2002. PMID: 12117943 Free PMC article.
-
Caspase 1 involvement in human monocyte lysis induced by Actinobacillus actinomycetemcomitans leukotoxin.Infect Immun. 2003 Aug;71(8):4448-55. doi: 10.1128/IAI.71.8.4448-4455.2003. Infect Immun. 2003. PMID: 12874324 Free PMC article.
-
Abundant secretion of bioactive interleukin-1beta by human macrophages induced by Actinobacillus actinomycetemcomitans leukotoxin.Infect Immun. 2005 Jan;73(1):453-8. doi: 10.1128/IAI.73.1.453-458.2005. Infect Immun. 2005. PMID: 15618184 Free PMC article.
-
Aggregatibacter actinomycetemcomitans Leukotoxin (LtxA; Leukothera®): Mechanisms of Action and Therapeutic Applications.Toxins (Basel). 2019 Aug 26;11(9):489. doi: 10.3390/toxins11090489. Toxins (Basel). 2019. PMID: 31454891 Free PMC article. Review.
-
Aggregatibacter actinomycetemcomitans leukotoxin: a powerful tool with capacity to cause imbalance in the host inflammatory response.Toxins (Basel). 2011 Mar;3(3):242-59. doi: 10.3390/toxins3030242. Epub 2011 Mar 18. Toxins (Basel). 2011. PMID: 22069708 Free PMC article. Review.
Cited by
-
Human CD18 is the functional receptor for Aggregatibacter actinomycetemcomitans leukotoxin.Infect Immun. 2007 Oct;75(10):4851-6. doi: 10.1128/IAI.00314-07. Epub 2007 Jul 16. Infect Immun. 2007. PMID: 17635865 Free PMC article.
-
Solution structure of the X4 protein coded by the SARS related coronavirus reveals an immunoglobulin like fold and suggests a binding activity to integrin I domains.J Biomed Sci. 2006 May;13(3):281-93. doi: 10.1007/s11373-005-9043-9. Epub 2005 Nov 23. J Biomed Sci. 2006. PMID: 16328780 Free PMC article.
-
Usefulness of real time PCR for the differentiation and quantification of 652 and JP2 Actinobacillus actinomycetemcomitans genotypes in dental plaque and saliva.BMC Infect Dis. 2006 Jun 13;6:98. doi: 10.1186/1471-2334-6-98. BMC Infect Dis. 2006. PMID: 16772039 Free PMC article.
-
Interleukin-1β Enhances Umbilical Cord Mesenchymal Stem Cell Adhesion Ability on Human Umbilical Vein Endothelial Cells via LFA-1/ICAM-1 Interaction.Stem Cells Int. 2019 Dec 27;2019:7267142. doi: 10.1155/2019/7267142. eCollection 2019. Stem Cells Int. 2019. PMID: 31949440 Free PMC article.
References
-
- Agarwal, S., N. P. Piesco, L. P. Johns, and A. E. Riccelli. 1995. Differential expression of IL-1 beta, TNF-alpha, IL-6, and IL-8 in human monocytes in response to lipopolysaccharides from different microbes. J. Dent. Res. 74:1057-1065. - PubMed
-
- Bradford, M. M. 1976. A rapid and sensitive method for the quantitation of microgram quantities of protein utilizing the principle of protein-dye binding. Anal. Biochem. 72:248-254. - PubMed
-
- Byrne, A., and D. J. Reen. 2002. Lipopolysaccharide induces rapid production of IL-10 by monocytes in the presence of apoptotic neutrophils. J. Immunol. 168:1968-1977. - PubMed
-
- Bzowska, M., K. Guzik, K. Barczyk, M. Ernst, H. D. Flad, and J. Pryjma. 2002. Increased IL-10 production during spontaneous apoptosis of monocytes. Eur. J. Immunol. 32:2011-2020. - PubMed
Publication types
MeSH terms
Substances
LinkOut - more resources
Full Text Sources
Research Materials
